
Fig. 4.
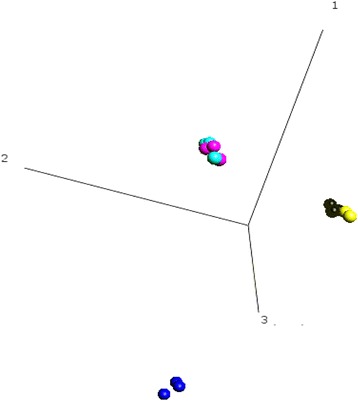
Gene expression analysis of equine monocytes (Mo) and eqMoDC. Mo (dark blue), iMoDC (black, FBS batch S0113; yellow, HS) and mMoDC (light blue, FBS batch S0113; pink, HS) were generated in parallel from three horses each. Principal component analysis (PCA) was carried out on the differentially expressed genes (1331 variables) and demonstrated that while the gene expression profiles of the different MoDC stages are separate and different to Mo, the genetic profile of the different sera cannot be further separated. Three biological repeats (horses) were analyzed using Qlucore, one dataset (iMoDC, HS) was discarded due to a technical issue in the hybridization of the sub-arra