
Fig. 6.
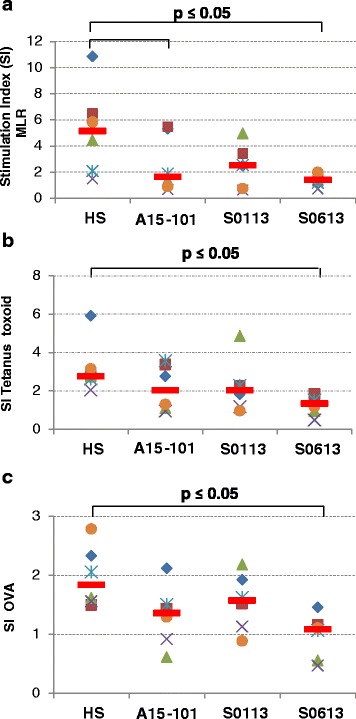
T cell proliferation induced by eqMoDC. T cells were stimulated with heterologous eqMoDC (mixed leukocyte reaction [MLR]) (a), as well as autologous eqMoDC primed with tetanus toxoid (b) or OVA (c). Results are displayed as stimulation indices (cpm with stimulation/cpm without stimulation). Each symbol indicates a separate horse (n = 6), with red lines indicating the median value. Non-parametric paired sample Wilcoxon (signed rank) tests were used to determine significant differences between the HS and the three FBS, respectively. P-values ≤ 0.05 were considered statistically significant