
Fig. 6.
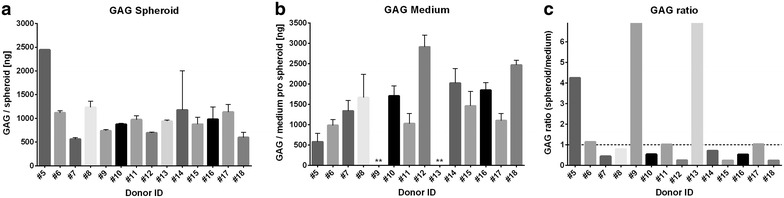
GAG produced per spheroid of individual donors. Produced sulfated GAGs per spheroid were quantitatively measured using the DMMB assay. a Amount of GAGs bound within the spheroids, as determined for three individual spheroids per donor. Only for donor #5, only one spheroid was analysed. b GAGs released into the medium per spheroid, as determined for the same three individual spheroids as the bound GAGs were determined for. **Donors #9 and #13 revealed negative values, indicating that GAGs were not detectable in medium. GAG was measured in spheroids of 14 ± 1 days, except for donor #14 and #18 where spheroids were cultivated for 24 days. Samples were measured in triplicates. Indicated are mean ± SD of single spheroids. c Calculated ratios of GAG bound within spheroids to GAG released into the medium per individual spheroid (Ratio GAGbound/GAGreleased). Dotted line indicates a ratio of 1.0, indicating an equal amount of bound and released GAG per spheroid. Ratios >1.0 indicates that the GAG content bound in the individual spheroids is larger than in media and ratios <1.0 indicates that the GAG content bound in spheroids is less than in media. For samples #9 and #13, no GAGs were measured in medium, and therefore the ratio of GAGs spheroid/medium could not be calculated and was set as infinite