Figure 5.


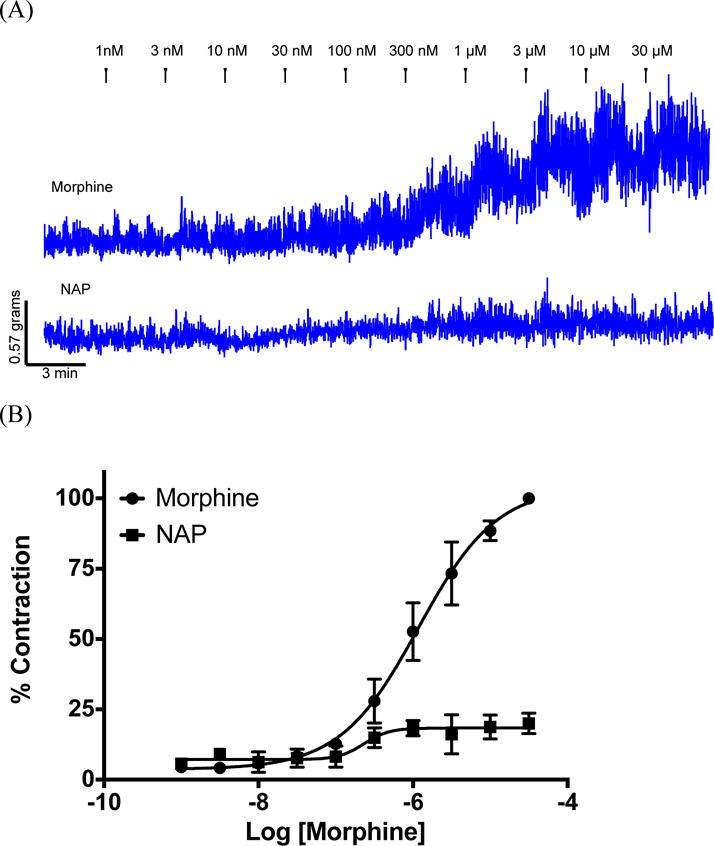
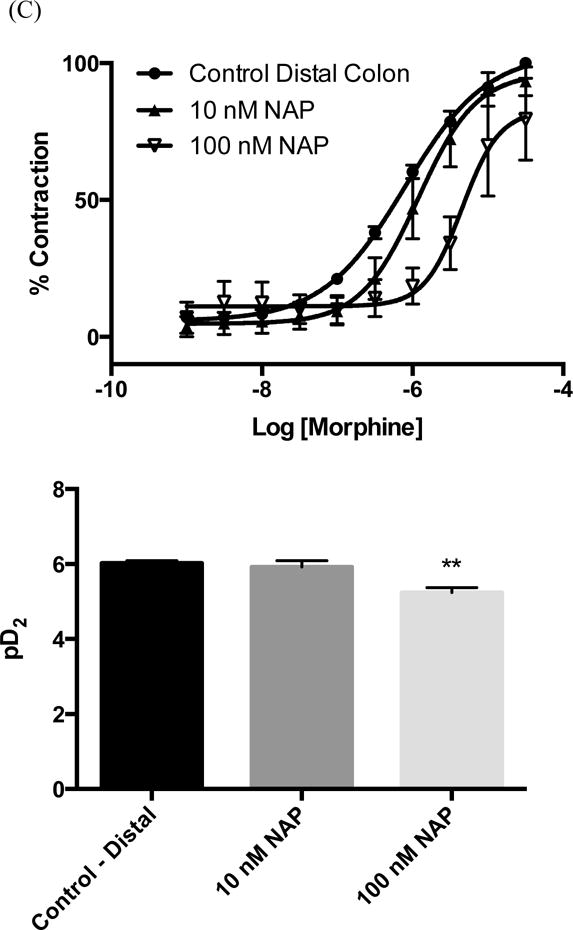
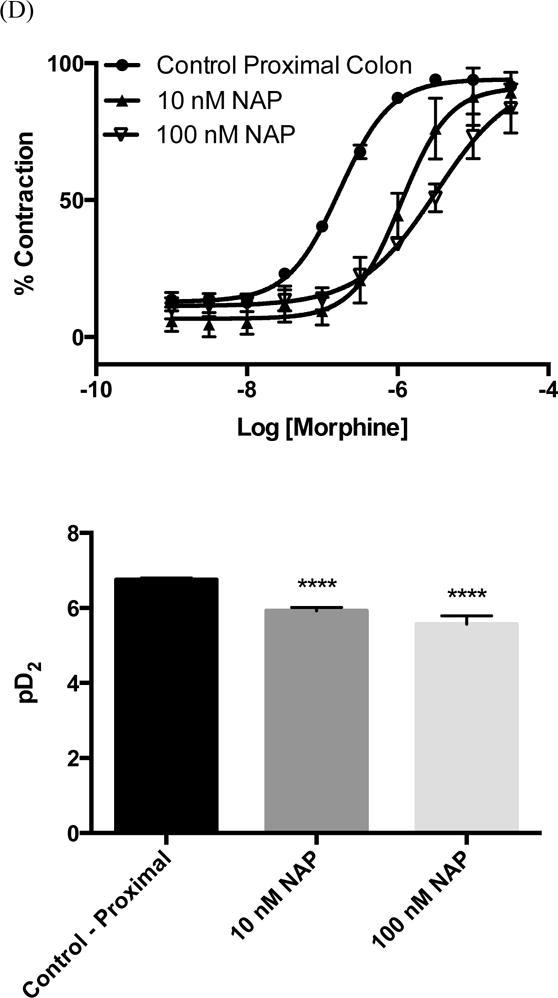
(A) Representative traces from mouse distal colon of circular muscle contractions to increasing concentrations of morphine (top) or NAP (bottom). Isometric tension recordings for morphine and NAP were obtained from the same animal. After an initial concentration-effect curve with morphine the tissue was washed extensively until basal levels returned (>2.5h) and then a concentration-effect experiment with NAP was conducted. Data for NAP were represented as a % of the maximum response obtained with morphine. These traces were from the distal colon; however the proximal colon gave similar results. (B). Quantification of raw traces was done by integrating the total responses between concentrations using the built-in software. Morphine in this assay behaved as a high potency high efficacy agonist pD2 = 5.9 ± 0.1. NAP did display low efficacy partial agonism in this assay (pD2 = 6.6 ± 0.2) however the statistical difference using a t-test between the response at 1nM and 30 μm was marginal (P = 0.02). Data were expressed as mean response ± S.E.M from at least three different animals. NAP Inhibitory effect on morphine-induced tissue contractions were shown in the distal (C) and proximal (D) colon tissue contraction.
