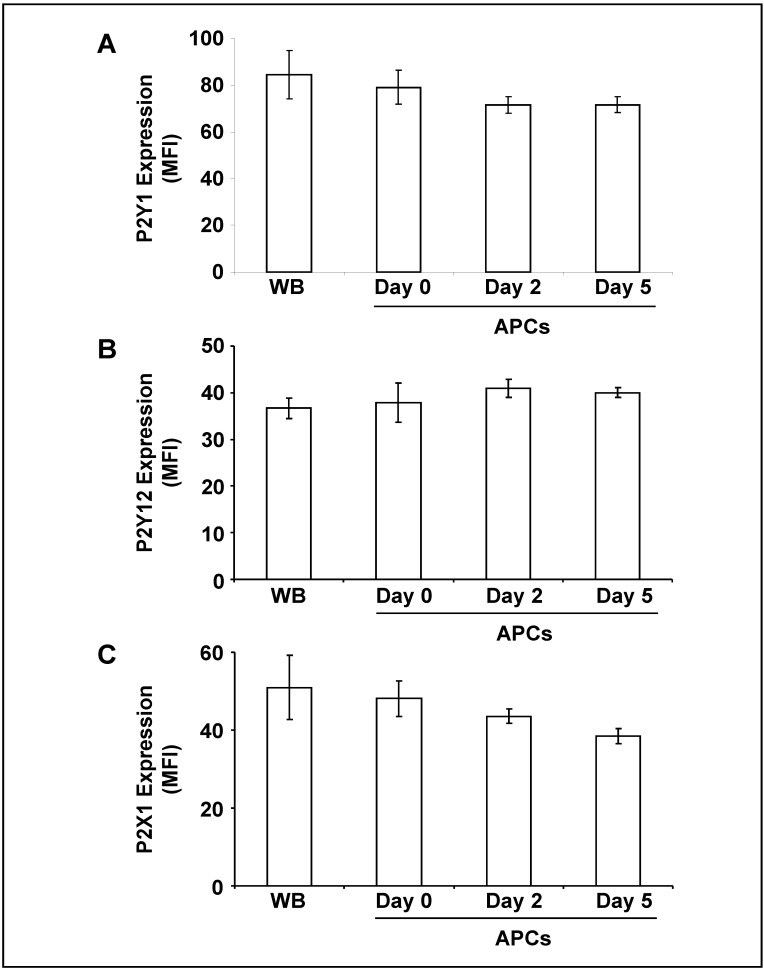
Figure 2.
Surface expression of purinergic receptors on platelets from fresh WB and from stored APC.
The histograms show the mean fluorescence intensity (MFI) of (A) P2Y1, (B) P2Y12 and (C) P2X1 surface expression on platelets as indicated. Results are presented in absolute arbitrary units as mean±SEM; n=7.
WB: whole blood; APC: apheresis-derived platelet concentrates; SEM: standard error of the mean.

