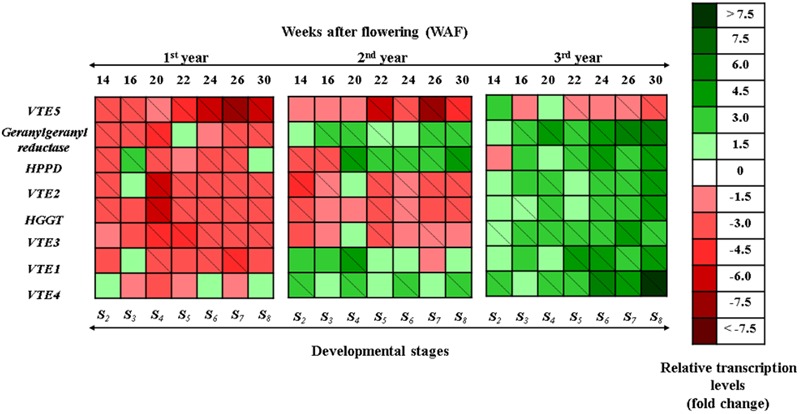
FIGURE 1.

Heat map showing temporal transcript expression pattern of the biosynthetic pathway of vitamin E in olive fruit (cv. “Koroneiki”) during 10–30 WAF for each of the three successive years in the experimental orchard. Relative mRNA abundance was evaluated by real-time RT-PCR using three biological repeats. Up-regulation is indicated in green; down-regulation is indicated in red. A diagonal line in a box indicates a statistically significant value (P ≤ 0.05). A scale of color intensity is presented as a legend. Actual relative transcript values are shown in Supplementary Figures S5–S7. Values that differ from the seasonal phase 10 WAF for each year, used as reference.
