
FIGURE 3.
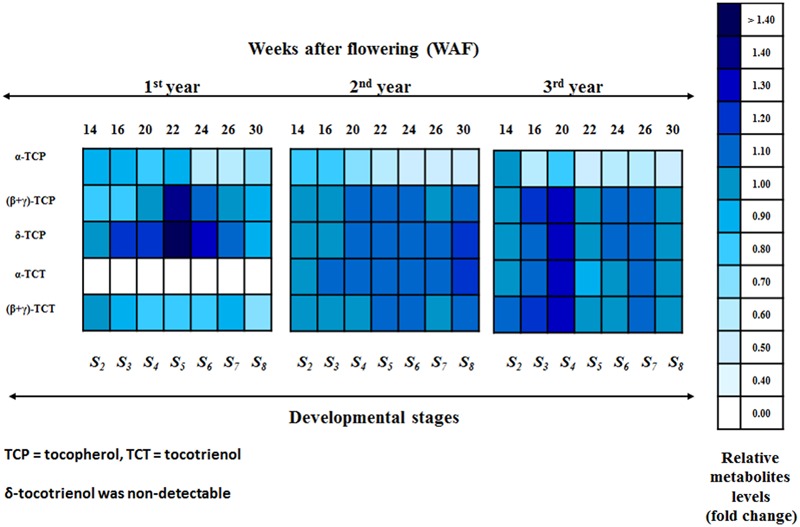
Heat map of the relative metabolite levels of the biosynthetic pathway of vitamin E in olive fruit (cv. “Koroneiki”) during 10–30 WAF. Relative metabolite levels were evaluated by HPLC using three biological repeats. A scale of color intensity is presented as a legend. Actual relative metabolite levels, obtained from three independent replicates, are shown in Supplementary Figures S8 and S9. Alpha-tocotrienol during the 1st year and δ-tocotrienol were non-detectable. Relative metabolite levels based on 10 WAF for each year.