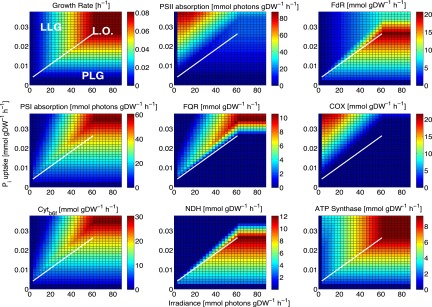
FIG 4 .
Phenotype phase planes of light and phosphate uptake for key photosynthetic fluxes. In each panel, the white line of optimality (L.O.) indicates optimal growth and delineates LLG (above) and PLG (below) phenotypes. FdR, ferredoxin-NADP+ reductase; FQR, ferredoxin:quinone oxidoreductase; COX, cytochrome oxidase bd; Cytb6f, cytochrome b6f; NDH, NADPH dehydrogenase type 1.

