
FIG 5 .
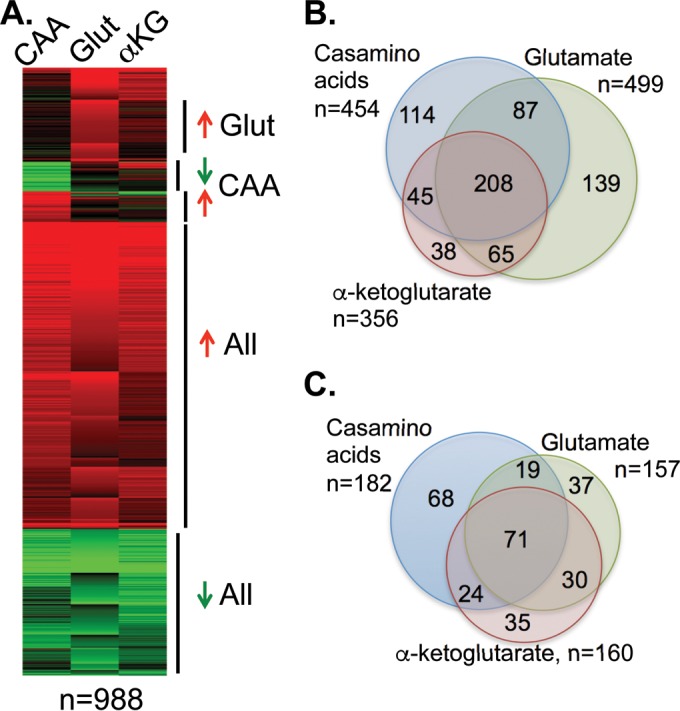
Transcriptional changes in response to amino acids or α-ketoglutarate are substantially similar. Transcriptional profiles were assessed using RNA sequencing of cells grown in minimal YNB medium containing glucose, Casamino Acids (CAA), glutamate (Glut), or α-ketoglutarate (αKG) for 5 to 7 h at 37°C. Ratios of transcript abundance based on the reads per kilobase per million (FPKM) metric under each condition relative to the expression in the glucose control were used to determine differentially regulated genes. (A) K-means clustering of differentially regulated genes demonstrates the similar changes under the three conditions. (B) Venn diagram of the overlap between the three conditions in genes upregulated by at least threefold. (C) Downregulated genes.