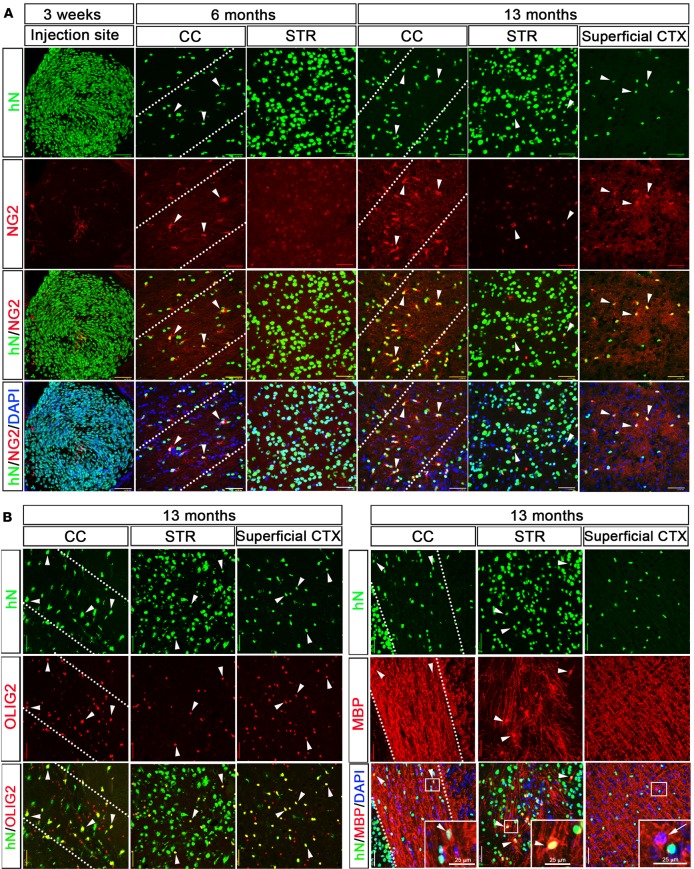
Figure 5. Oligodendroglial differentiation of neonatally engrafted hiPSC-pNPCs.
(A) Representative images of NG2-expressing cells in the human nuclear antigen–positive (hN+) cells near the injection site at 3 weeks after transplantation, and in the corpus callosum (CC), striatum (STR), and superficial cerebral cortex (CTX) at 6 and 13 months after transplantation. Arrowheads indicate the hN+/NG2+ human cells. Scale bars: 50 μm. The dotted lines highlight the CC region. (B) Representative images of OLIG2- and MBP-expressing oligodendroglial cells in the hN+ cells in the CC, STR, and superficial CTX at 13 months after transplantation. Arrowheads indicate the hN+/OLIG2+ human oligodendroglia or hN+/MBP+ mature oligodendrocytes. The arrow indicates the hN–/MBP+ endogenous host mature oligodendrocytes. Areas outlined in white boxes are enlarged. Scale bars: 50 μm (original) and 25 μm (enlarged). hiPSC-pNPCs, human induced pluripotent stem cell–derived primitive neural progenitor cells.

