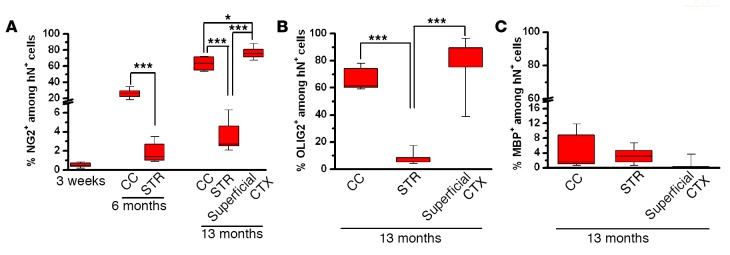
Figure 6. Quantification of the oligodendroglial cells differentiated from the engrafted hiPSC-pNPCs.
(A–C) The percentage of NG2-, OLIG2-, and MBP-expressing cells in the hN+ cells at different brain regions from 3 weeks to 13 months (n = 6 for each time point). All quantitative data are analyses of pooled data collected from transplantation of hiPSC1- and hiPSC2-pNPCs. Data are presented as box-and-whisker plots. The central horizontal bars indicate the medians, boxes indicate 25th to 75th percentiles, and whiskers indicate the range of the data points. Student’s t tests and 1-way ANOVA were performed to assess the significance. *P < 0.05 and ***P < 0.001. hiPSC-pNPCs, human induced pluripotent stem cell–derived primitive neural progenitor cells.

