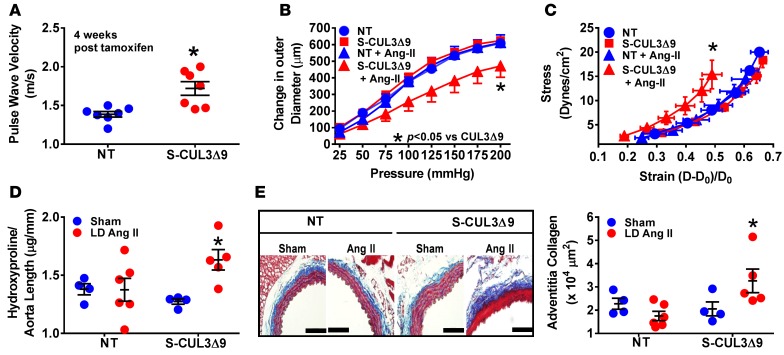
Figure 8. Aortic compliance in S-CUL3Δ9 mice.
(A) Pulse wave velocity measurements in nontransgenic (NT) and S-CUL3Δ9 mice, as determined by Doppler ultrasound. n = 7/genotype. *P < 0.05 S-CUL3Δ9 vs. NT by 1-way ANOVA. (B and C) Pressure-diameter curves (B) and stress-strain relationships (C) of NT and S-CUL3Δ9 aortas. n = 4–6/genotype/treatment. *P < 0.05 angiotensin II (Ang II) S-CUL3Δ9 vs. all other curves by 1-way repeated-measure ANOVA. (D) Aortic collagen, as measured by hydroxyproline assay. n = 4–6/genotype/treatment. *P < 0.05 Ang II S-CUL3Δ9 vs. all other samples by 1-way ANOVA. (E) Adventitial collagen was determined by Masson trichrome staining. Original magnification, ×40; scale bar: 100 μm. n = 4–6/genotype/treatment. *P < 0.05 Ang II S-CUL3Δ9 vs. all other samples analyzed by 1-way ANOVA.

