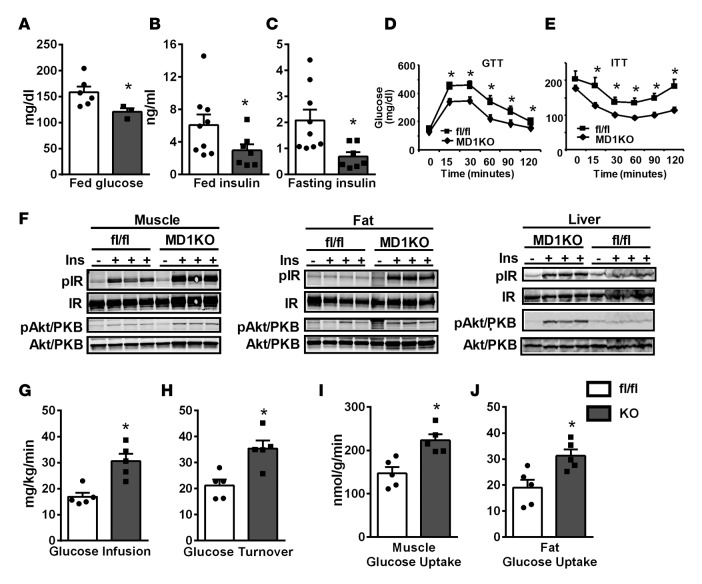
Figure 6. Mice with myeloid-lineage deletion of DNMT1 (MD1KO) exhibit improved insulin sensitivity.
(A–C) Fed glucose (A), fed insulin (B), and fasted insulin (C) in MD1KO and fl/fl control mice fed a high-fat (HF) diet for 12 to 14 weeks. (D and E) Glucose tolerance test (GTT, D) and insulin tolerance test (ITT, E) in MD1KO and fl/fl mice fed an HF diet for 18 to 22 weeks. (F) Insulin signaling events in muscle, fat, and liver in MD1KO and fl/fl mice fed an HF diet for 24 weeks. (G–J) Glucose infusion rate (G), glucose turnover rate (H), and muscle (I) and fat (J) glucose uptake in MD1KO and fl/fl mice fed an HF diet for 24 weeks as assessed by hyperinsulinemic-euglycemic clamp. Data are expressed as the mean ± SEM. n = 3–9. *P < 0.05. Differences between groups were analyzed for statistical significance by Student’s t test or ANOVA with repeated measures.

