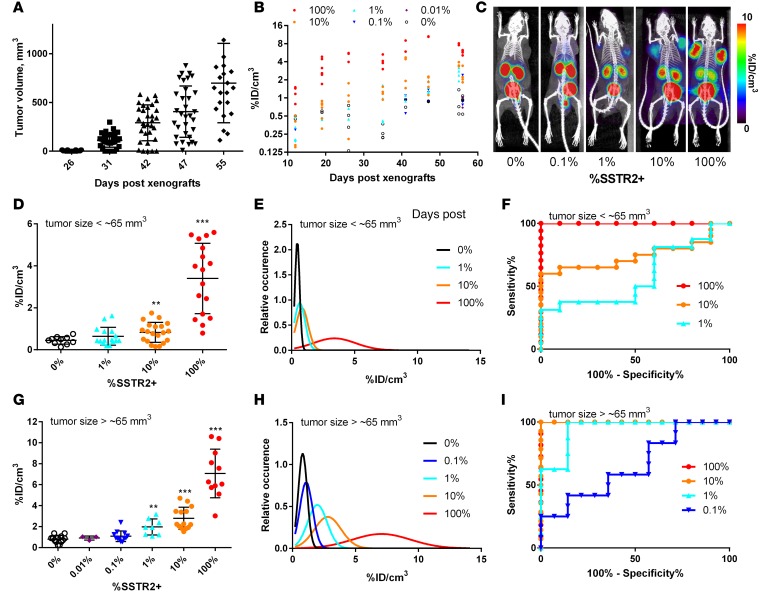
Figure 2. Quantitative PET/CT measurement of DOTATOC uptake by Jurkat tumors and statistical analysis.
(A) Tumor volume (mm3) plotted against number of days after xenograft. (B) Measured DOTATOC uptake is quantified as percentage injection dose per volume (%ID/cm3) for Jurkat tumors (100%–0% SSTR2+) over the course of tumor growth. (C) Representative PET/CT images of mice xenografted with Jurkat T cells at 0%, 0.1%, 1%, 10%, and 100% SSTR2 expression. Images are maximum intensity projections (MIPs) of the entire mouse body (~20-mm-thick plane). PET intensity is pseudocolored in the range of 0–10 %ID/cm3. (D and G) DOTATOC uptake (%ID/cm3) for Jurkat tumors less or greater than 65 mm3, respectively. (E and H) Simulated Gaussian distribution as a function of the measured mean and standard deviation of DOTATOC uptake for each percentage SSTR2+ tumor when the volume is less or greater than 65 mm3, respectively. (F and I) Receiver operating characteristic (ROC) curves of percentage sensitivity and specificity are shown for tumors less than 65 mm3 (D) and greater than 65 mm3 (G). ** P < 0.01 vs. 0%, ***P < 0.001 vs. 0%, by Student’s t test.

