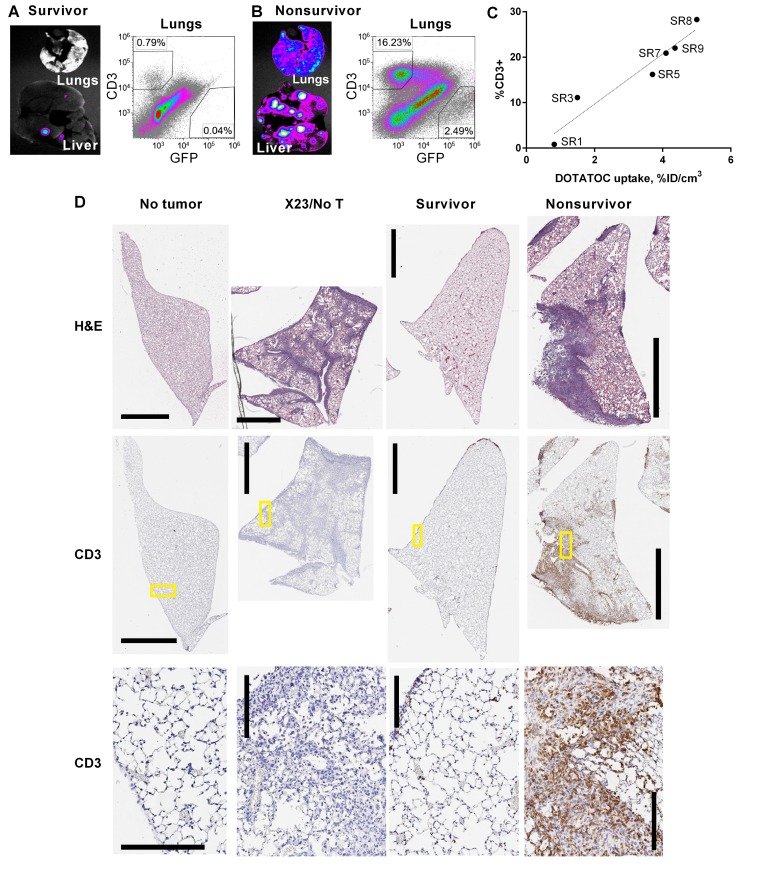
Figure 6. Ex vivo analysis of CAR T cell and tumor density in lungs.
Ex vivo, GFP+ tumor cell fluorescence of representative lungs and liver, and flow cytometry of total, live-gated lung cells from (A) survivors (n = 4) and (B) nonsurvivors (n = 5). Organs were harvested, imaged, and analyzed by flow cytometry on day 28 after xenograft (X28). (C) DOTATOC uptake (percentage injection dose per volume [%ID/cm3]) by the lungs in SR1–SR9 mice are plotted against the percentages of T cells (CD3+) determined by flow cytometry. (D) Representative histological images are shown for paraffin-embedded H&E-stained sections of 1 entire lung lobe (top), and anti–human CD3 antibody with hematoxylin counterstain (middle). High-magnification views (yellow boxed regions in middle sections) show tumor cells and CD3-stained T cells (bottom). Tumor cells are identified by dark hematoxylin-stained nuclei. Human CD3+ cells are stained brown. Scale bars: 2 mm (top and middle sections) and 200 μm (bottom sections). Lungs were harvested from healthy mice with no tumor, mice 23 days after tumor xenograft and no T cell treatment (X23/no T cell), and X28 for T cell–treated survivors and nonsurvivors.

