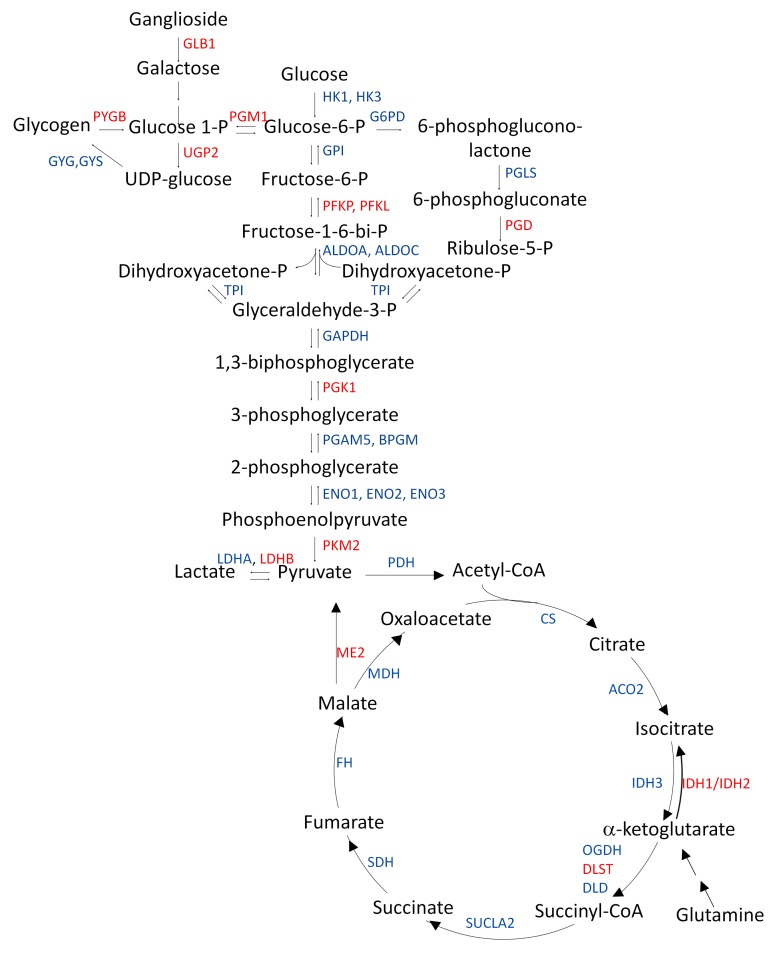
Figure 1. Proteomic changes in carbohydrate metabolic enzyme expression in the bronchial brushings of individuals at high risk for lung cancer.
All enzymes shown as gene symbols (blue and red) were detected by shotgun proteomic (LC-MS/MS) analysis of cytologically normal airway epithelial cells from individuals at low, medium, and high risk for lung cancer. Equal amounts of protein (20 μg) were pooled from each bronchial brushing lysate of each of the low-risk (n = 5), medium-risk (n = 5), and high-risk (n = 5) groups to create a 100-μg pooled protein lysate. Jonckheere-Terpstra trend analysis was performed with the risk groups using normalized spectral count obtained from LC-MS/MS data. Gene symbols of overexpressed enzymes are shown in red and gene symbols shown in blue are not overexpressed. Jonckheere-Terpstra trend analysis was performed with the risk groups using normalized spectral count obtained from LC-MS/MS data.

