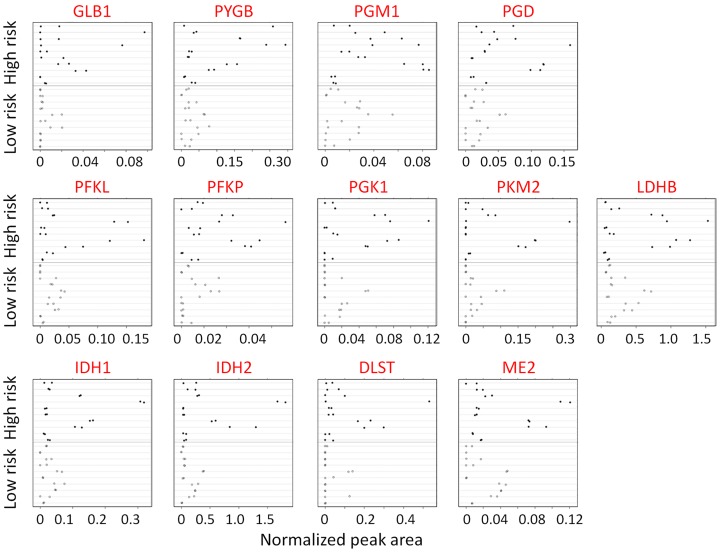
Figure 3. Validation of protein expression by quantitative measurements of carbohydrate metabolic enzyme expression by PRM MS in an independent set of individual bronchial brushings.
Each sample was analyzed on a Q-Exactive mass spectrometer using an acquisition method that combined a full-scan SIM event followed by 14 PRM scans. Two replicates of each specimen from low-risk individuals (n = 10) were compared with those of the high-risk individuals (n = 10). Likelihood ratio test based on mixed effect model. Top row: enzymes involved in glycogenolysis and galactose supply that feeds glucose into glycolysis and the pentose phosphate pathway. Middle row: glycolytic pathway enzymes. Bottom row: TCA cycle enzymes.

