
Fig. 2.
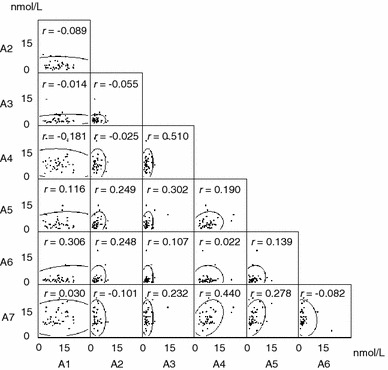
Scatter plot matrix from 289 samples with 95% equal probability ellipse and correlation coefficient between the variables. A1–A7 Sampling time points (see Fig. 1) over the 48-h study cycle, r correlation coefficient
Official websites use .gov
A
.gov website belongs to an official
government organization in the United States.
Secure .gov websites use HTTPS
A lock (
) or https:// means you've safely
connected to the .gov website. Share sensitive
information only on official, secure websites.
Scatter plot matrix from 289 samples with 95% equal probability ellipse and correlation coefficient between the variables. A1–A7 Sampling time points (see Fig. 1) over the 48-h study cycle, r correlation coefficient