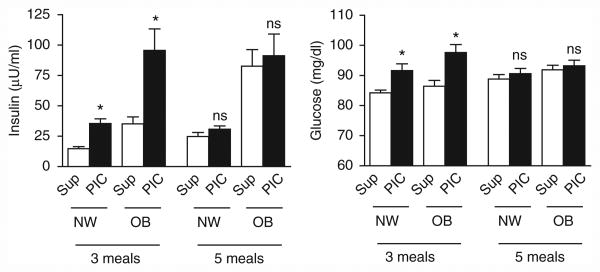
Figure 4.
Insulin and glucose concentrations determined pre-supper (Sup) and pre-ice cream (PIC) in NW and OB children after the meal pattern indicated. *P < 0.001 compared to pre-supper. Data were analyzed by two-factor linear mixed model analysis comparing the effect of meal pattern (three or five meals) and time (Sup or PIC) with repeated measures for both factors. The analysis considers all the insulin and glucose data (assessed pre-meals and pre-ice cream, and presented in detail in Figure 1 of supplementary data online). NW, normal weight; OB, obese.

