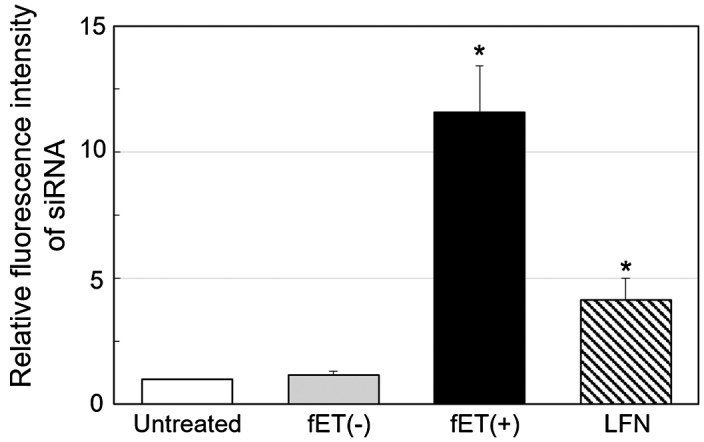
Figure 3.

Relative fluorescence intensity of cells after fET with fluorescently labeled siRNA.
Cells were treated with fET (0.34 mA cm–2, 15 min) in the presence of rhodamine-labeled siRNA. Three hours after fET, the cells were lysed, and the fluorescence intensity of the lysate was measured. Data were obtained by three separate experiments, and are expressed as mean ± SD. *p<0.05 versus untreated.
