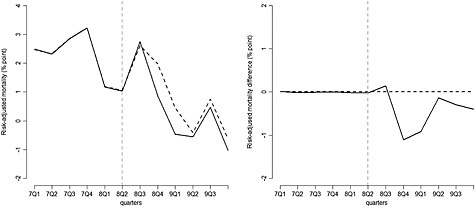
Figure 2.

Left panel: Risk‐adjusted 30‐day hospital mortality, for patients admitted with incentivised conditions: the North West of England (solid line) vs. the synthetic North West (dashed line). Right panel: Gap in risk‐adjusted 30‐day hospital mortality for patients admitted with incentivised conditions: the North West of England vs. the synthetic North West. The vertical dashed lines indicate the last pre‐treatment period (base case)
