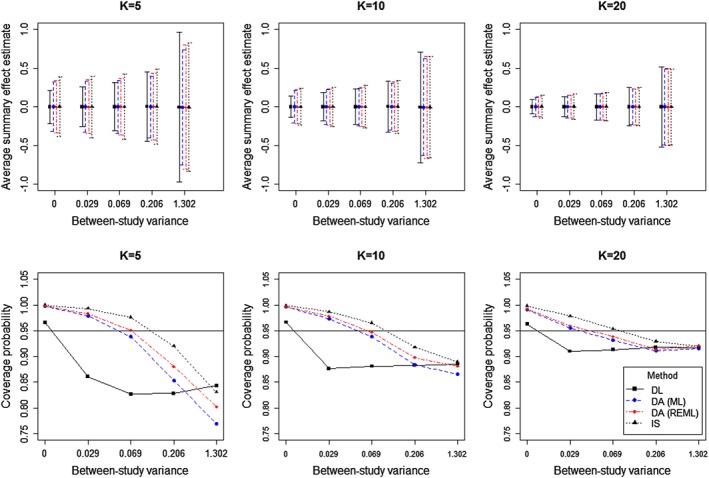
Figure 2.

Average estimates with corresponding 95% intervals [top row] and coverage probabilities of estimated 95% intervals for the summary effect μ [bottom row] from the simulation study, using 20 000 simulations for each combination of τ 2 and K, plotted on the logarithm scale. In each case, DL denotes conventional estimation by the DerSimonian and Laird procedure. DA and IS denote Bayesian methods by data augmentation and importance sampling, respectively.
