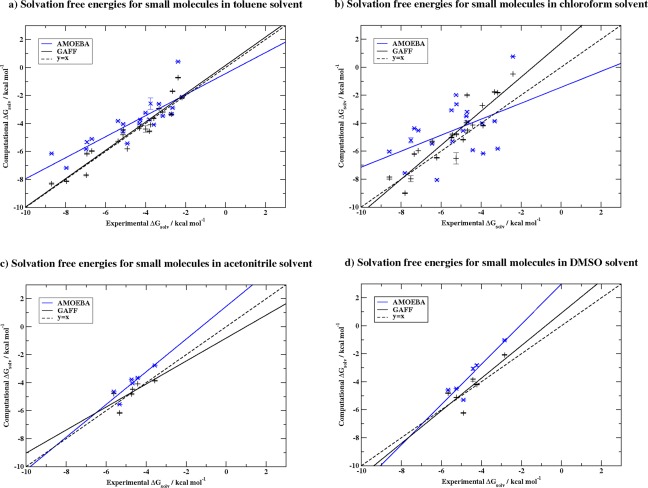
Figure 3.

AMOEBA (blue) and GAFF (black) calculated ΔG solv for small molecules in toluene, chloroform, acetonitrile and DMSO against experimental ΔG solv. Line of perfect agreement, y = x, shown as dashed line. Linear regression in each solvent plot gives the following equations: a) AMOEBA (y = 0.752 x − 0.4375), GAFF (y = 1.012 x + 0.153) b) AMOEBA (y = 0.571 x − 1.435), GAFF (y = 1.217 x + 1.722) c) AMOEBA (y = 1.169 x + 1.452), GAFF (y = 0.822 x − 0.813) and d) AMOEBA (y = 1.436 x + 2.986), GAFF (y = 1.164 x + 0.907). [Color figure can be viewed at wileyonlinelibrary.com]
