Figure 2.

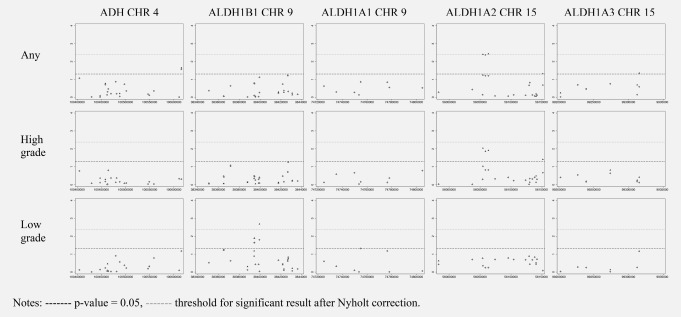
Manhattan plots of association of SNPs, in 5 regions involved in alcohol metabolism, with prostate cancer‐specific survival by prostate Cancer grade.

Manhattan plots of association of SNPs, in 5 regions involved in alcohol metabolism, with prostate cancer‐specific survival by prostate Cancer grade.