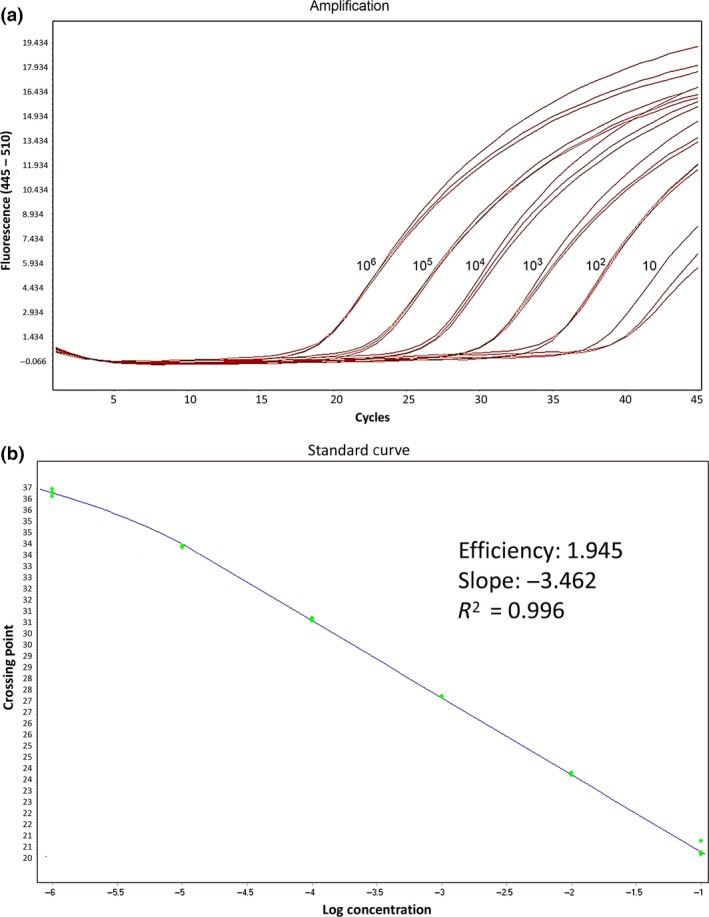
Figure 2.

(a) Amplification plots of Mp1 plasmids with dilution concentrations from 106 to 101 copies per reaction, showing increase in the fluorescence emission of the reporter dye relative to the reference dye. (b) Linear regression of the crossing point values vs. log10 concentration of Mp1 plasmids. All the samples were performed in triplicate.
