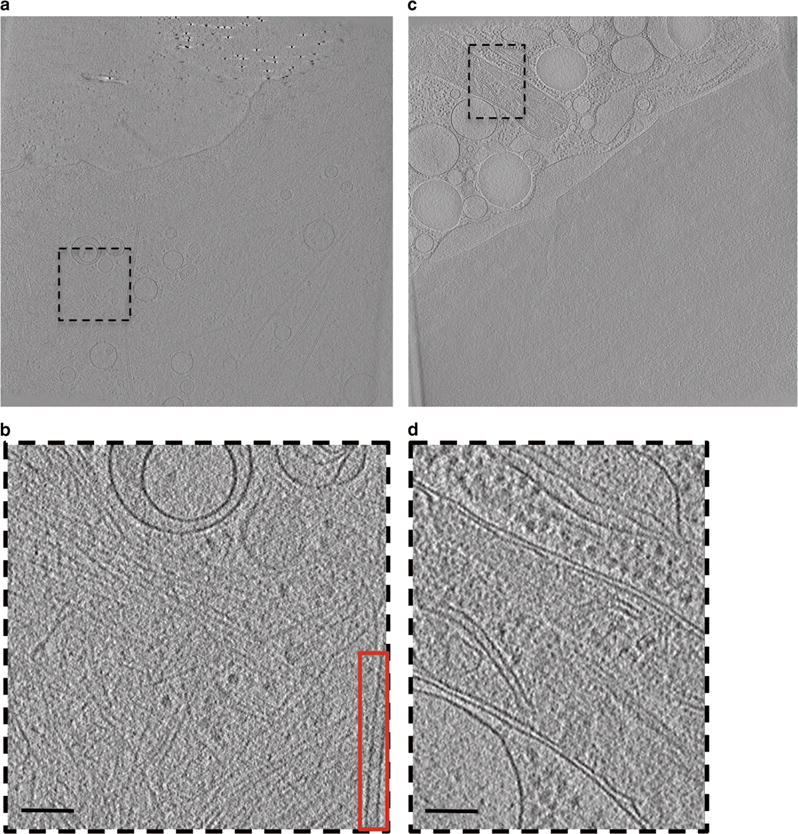
Figure 1.

Raw cellular tomograms including features to be annotated. Single slices through raw tomograms of intact mammalian cells (a,c). Boxed regions in (a) and (c) represent areas of interest selected for annotation (displayed in b,d). Actin and a single microtubule were annotated from (b) and red inset respectively, whereas mitochondria was annotated from (d). Scale bars are 100 nm.
