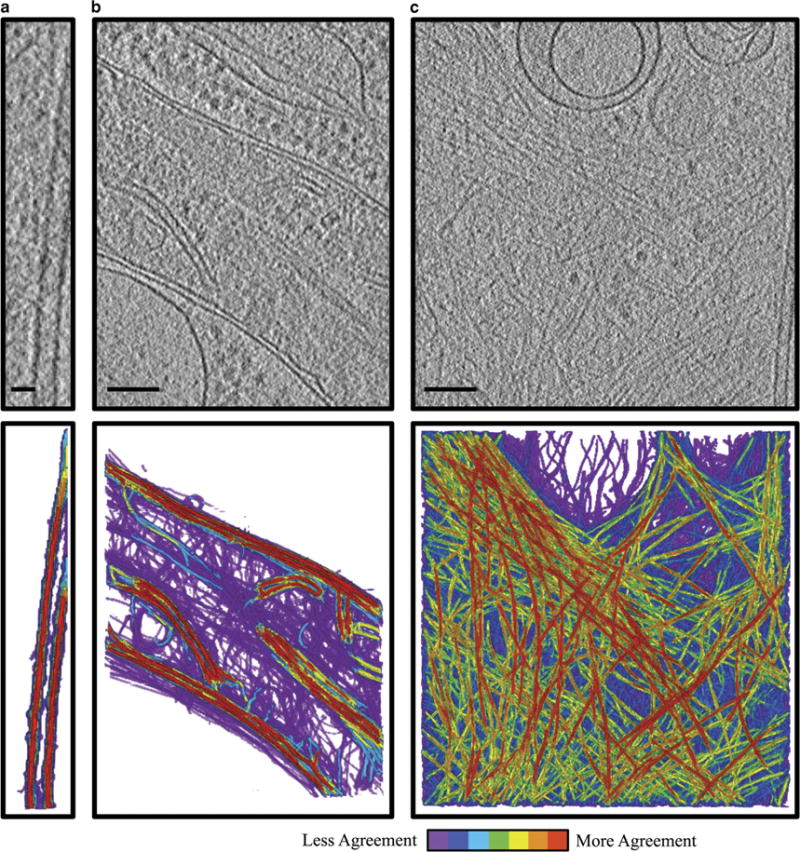
Figure 4.

Summation of annotations demonstrates inherent variability between annotations of the same feature. Projection images through ~180 nm slabs from a tomogram of intact mammalian cells (top) and merged annotations of each feature of interest (bottom). Red indicates voxels that were selected by all of the annotators, whereas purple indicates voxels that were selected by a single annotator (n = 7 for microtubule and actin, n = 4 for mitochondria). Note that purple indicates voxels from multiple individuals’ annotations, which have no agreement with anyone else’s annotations. Microtubules, a high contrast, easily annotated sample, show high agreement between annotators (a). Mitochondria, an intermediate sample with variations in contrast between outer membrane and cristae, shows some regions of high agreement, mainly at the outer membrane, and some of low, mainly in the dense regions internal to the mitochondria (b). Actin, a low contrast, difficult to annotate sample, shows many regions of low agreement (c). Scale bar is 25 nm for (a), Scale bar is 100 nm for (b) and (c).
