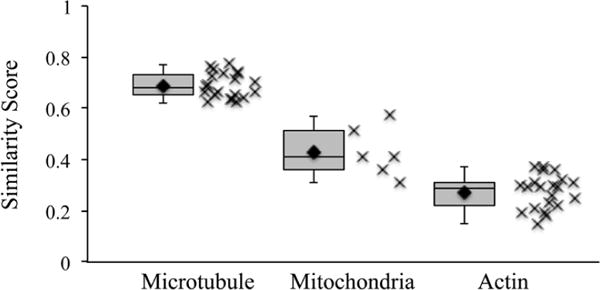
Figure 5.

The mean similarity score is dependent on the complexity of the feature being annotated. Box and whisker, and scatter plots of pairwise, voxel-based similarity scores for various samples. The average similarity scores are 69 ± 5, 43 ± 9, and 27 ± 6% for microtubules, mitochondria, and actin, respectively. Because of the high contrast and simplicity of microtubules, they represent a best-case scenario.
