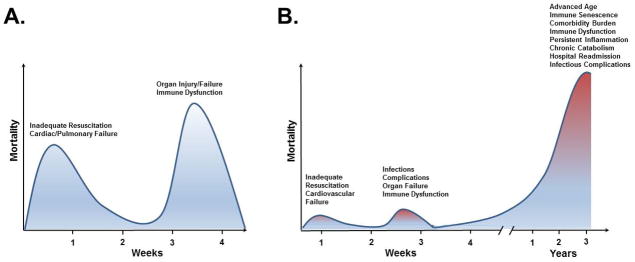
Figure 6. Past and Present Mortality Distribution Sepsis.
(A.) Classically, the mortality distribution from sepsis occurred in a biphasic pattern, with an initial peak due to inadequate resuscitation resulting in cardiac and pulmonary failure and a second peak at several weeks from persistent organ dysfunction. Considering the recent trends in physiologic frailty, the growing elderly population, and mounting long-term mortality, a trimodal distribution is more indicative of the current sepsis-associated mortality. (B.) The two early peaks in mortality still do exist but with much less magnitude than in the past. The third and largest upswing occurs beginning at 2–3 months after sepsis and continues to steeply climb as time progresses. This delay in sepsis mortality is attributed to significant advances in ICU care that keeps the elderly and co-morbidly challenged patients alive longer despite ongoing immune, physiologic, metabolomics and biochemical aberrations.

