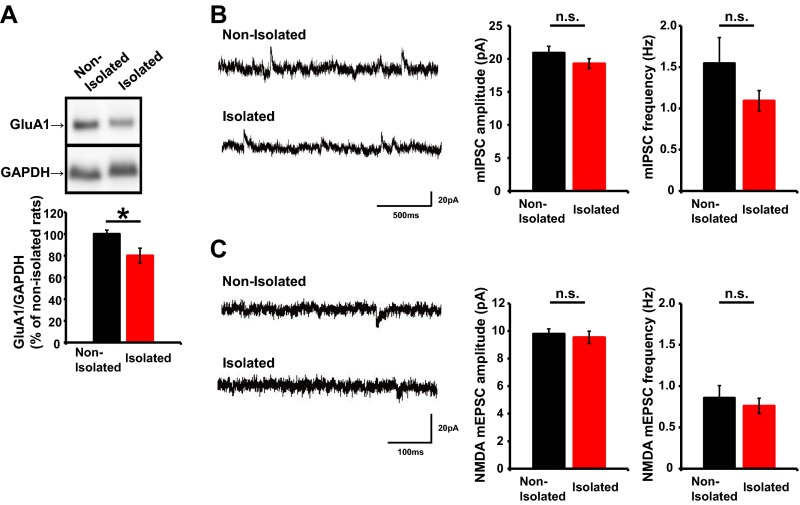
Fig. S6.
(A) (Top) Representative Western blots of PSD fractions obtained from the mPFC of socially isolated and nonisolated rats. (Bottom) Graph depicting the average ratio of GluA1 to GAPDH (n = 6 rats nonisolated and 6 rats isolated). (B) (Left) Representative mIPSC traces obtained from layer 2/3 pyramidal neurons in the mPFC of socially isolated or nonisolated juvenile rats. (Right) Graphs depicting the average mIPSC amplitude and frequency (n = 10 neurons nonisolated and 6 neurons isolated). (C) (Left) Representative NMDA-mEPSC traces obtained from layer 2/3 pyramidal neurons in the mPFC of socially isolated or nonisolated juvenile rats. (Right) Graphs depicting the average NMDA-mEPSC amplitude and frequency (n = 7 neurons nonisolated and 6 neurons isolated). *P < 0.05 (unpaired Student’s t test). Error bars represent SEM. n.s., not statistically significant.

