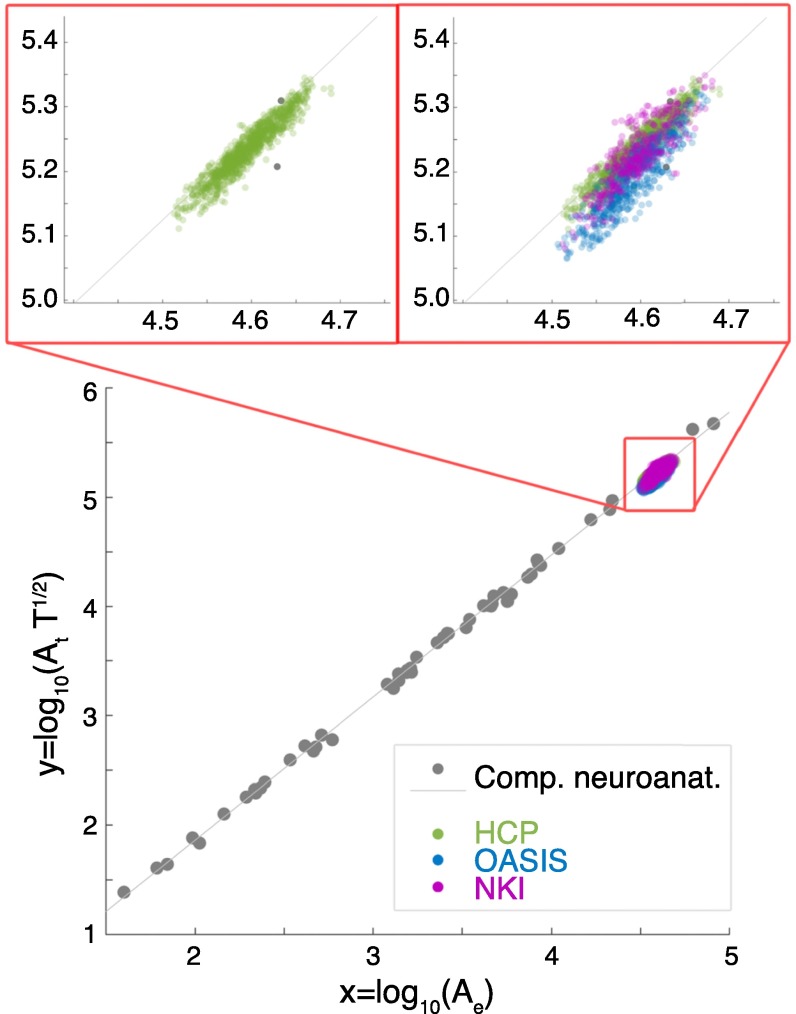
Fig. 1.
Comparing MRI-derived human datasets with the established neuroanatomy dataset for mammalian brains. The scaling law for the comparative neuroanatomy (Comp. neuroanat.) data across different species is shown in gray. The gray regression line is also obtained for these data, with a slope of 1.305. Overlaid are the human MRI-derived datasets: green for the HCP, blue for the OASIS, and magenta for the NKI. Insets (red frame) show the human MRI-derived data in more detail relative to the regression line of the interspecies data. Note that the two gray dots in Left Inset are from the previous Comp. neuroanat. dataset for humans.

