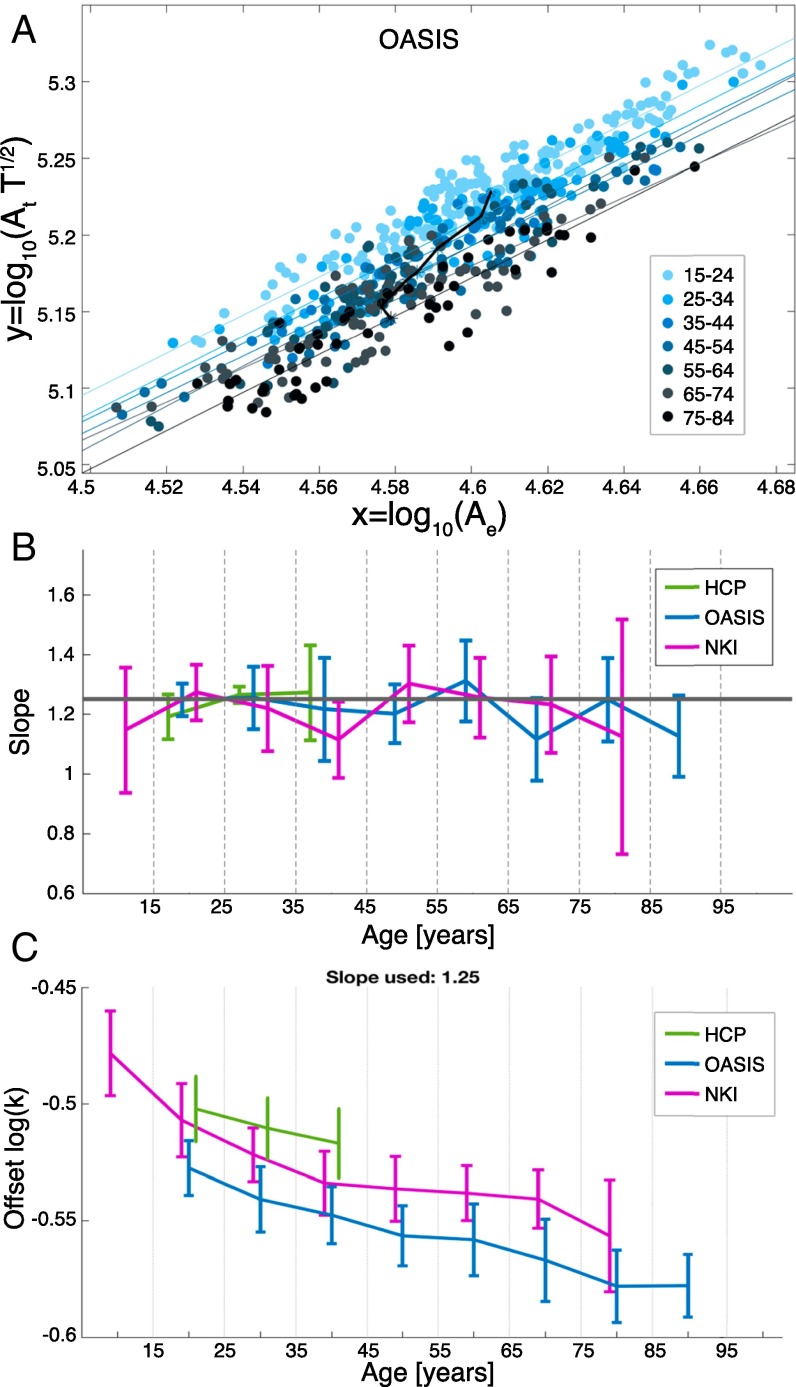
Fig. 3.
Change in the scaling behavior with age. (A) Scaling law for different age groups in the OASIS dataset using both males and females. Regression lines are shown in the corresponding color as the age group. The age group average is shown as a black solid line. (B) The scaling law slope estimate is shown with 95% confidence intervals for each age group for all three datasets. The solid gray line indicates the 1.25 slope predicted by the theory. (C) Using the predicted slope of 1.25, the average estimated offset is shown for all three datasets over age (details are in Materials and Methods). The error bars indicate the standard deviations. The original data for the estimated offset are shown in SI Appendix, Fig. S3.

