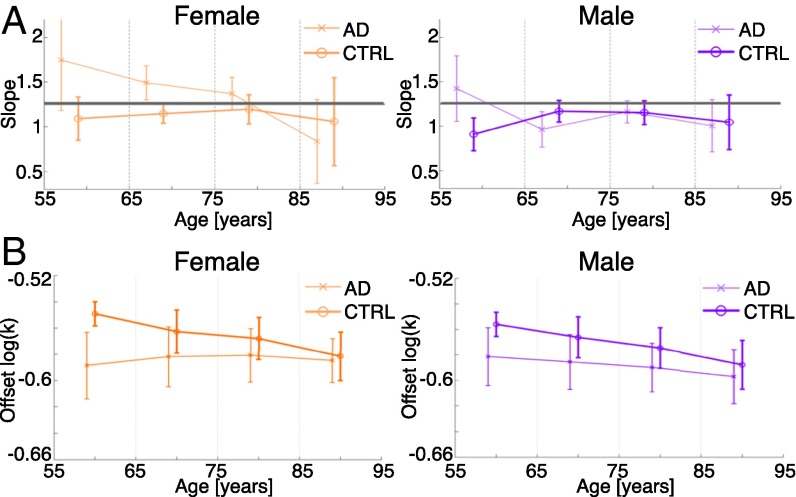
Fig. 4.
Scaling behavior in Alzheimer’s disease. (A) Slope of scaling law for females and males for different age groups of Alzheimer’s disease patients (AD) and healthy controls (CTRL). The vertical dashed gray lines mark the boundaries used for the age groups. The horizontal solid gray lines indicate the theoretically predicted slope value of 1.25. (B) Means and standard deviations of the estimated offset are also shown. The offset was estimated assuming the theoretically predicted slope value of 1.25.

