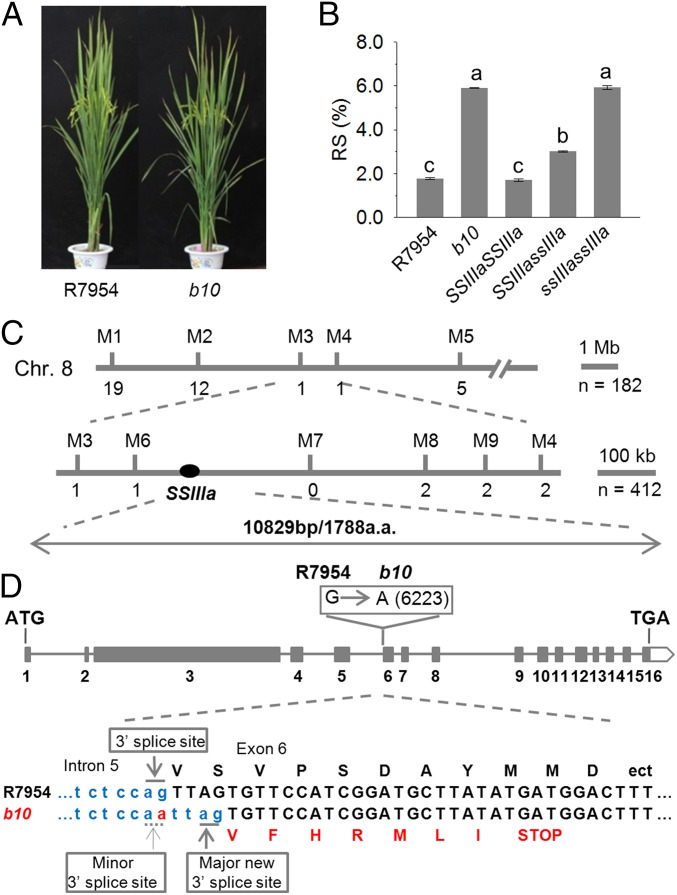
Fig. 1.
Characterization of the RS mutant b10 and positional cloning of the B10 gene. (A) Plant phenotype of the wild type (R7954) and the high-RS mutant (b10). (B) RS contents of grains from R7954 and b10 and from plants carrying different SSIIIa alleles in an F2 population from a cross between R7954 and b10. Error bars represent ±SEM (n = 62). Different letters above bars indicate significant differences at P < 0.05, using Tukey’s multiple comparison test. (C) Mapping of the target gene between the markers M6 and M8 on the short arm of chromosome 8. Numbers below the lines indicate the number of recombinants between the locus and the markers shown. (D) SSIIIa gene structure and mutation site. Filled boxes indicate exons (numbered 1–16) of SSIIIa. Site of the mutation from G to A in SSIIIa of b10 is shown in the open box above exon 6. Nucleotide sequences of the junction between intron 5 and exon 6 in R7954 and b10 are shown in Lower, with deduced amino acid sequences. The mutated nucleotide in b10 is shown in red, together with the loss of original 3′ splice site and creation of a new 3′ splice site. The mutation generates a recognition site for MluC I (AATT), which is used to generate a CAPS marker (Fig. S1) to determine genotypes of the plants shown in B.

