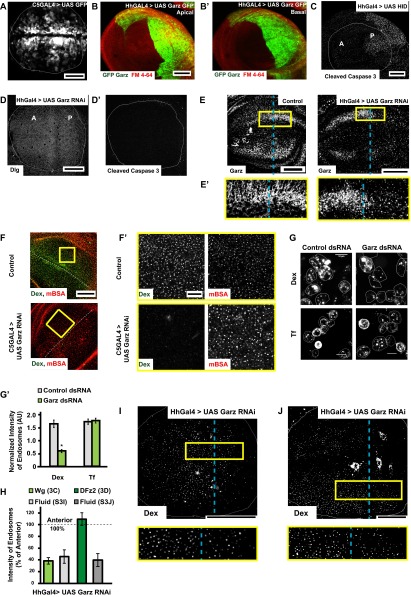
Fig. S3.
Garz perturbation specifically affects fluid phase and Wg endocytosis (supplementary to Fig. 3). (A and B) Confocal Z projections of wing discs showing the expression pattern of GAL4 drivers using UAS GFP with C5GAL4 (green, expressed in the wing pouch but not in the D/V boundary) and UAS GFP–Garz with HhGAL4 [green, expressed in the posterior compartment (Right)] with Apical (B) and Basal (B′) patterns indicated distinctly. (C–D′) Confocal Z projections of wing discs in which UAS-Hid (C; head involution defective) or Garz RNAi (D, D′) has been driven for 36–42 h using Hh GAL4 showing immunostaining of the apoptosis marker, cleaved caspase 3 (C, D′) or polarity marker Dlg (D). Note the specificity of apoptosis marker; cleaved caspase 3 is validated in wing discs wherein the proapoptotic gene Hid was driven using Hh GAL4. In all of the experiments described in the text, Garz RNAi was only driven for 36–40 h using Hh GAL4. (E) Confocal Z projections of Control (w1118) [Left] and Garz RNAi driven using HhGAL4 wing discs [Right] immunostained for Garz. The RNAi reduces the levels of Garz in the posterior part of the wing disc as seen in the Inset (E′) (magnification, ∼3×), without affecting the levels in the anterior, unlike wild-type (Control) wing disc is shown (Left), where the levels are similar in the anterior and posterior parts of the disc. (F and F′) Five- to 10-min uptake of Dex and mBSA in Control and C5GAL4 driving Garz RNAi wing discs. Dex endocytosis is severely affected but mBSA remains unaffected, as seen in the higher-magnification (∼4×) views of the outlined regions in F (F′). (G and G′) Dex and transferrin uptake evaluated in S2R+ cells with ds RNA against Zeocin (control) or Garz. (G′) Normalized transferrin uptake is not affected, but Dextran uptake is. *P < 10−20, n = 150–200 cells. (H) Quantification of endocytosis (intensity of endosomes) from the posterior cells where Garz RNAi is driven with Hh GAL4 calculated as a percent of anterior intensities from wing discs (n = 7–8): Wg (image shown in Fig. 3C), DFz2 (image shown in Fig. 3D), Dex in the same disc as shown in Fig. 3C (I), Dex in the same disc as Fig. 3D (J). I and J are images of Dex uptake in wing discs depicted in Fig. 3 C and D, respectively (yellow outlined boxes magnified ∼2.5× below), wherein Garz RNAi is driven in the posterior compartment using Hh GAL4 and pulsed for Dextran/Wg (I, quantified in H; see also Fig. 3C) and Dex/DFz2 (J, quantified in H; see also Fig. 3D). All images are background-subtracted with intensities appropriately scaled for representation. Posterior compartment is to the right in all wing discs. Dashed blue line approximately indicates the A/P compartment boundary. (Scale bars, 50 μm in A–F, I, and J and 10 μm in F′ and G.)

