Fig. S6.
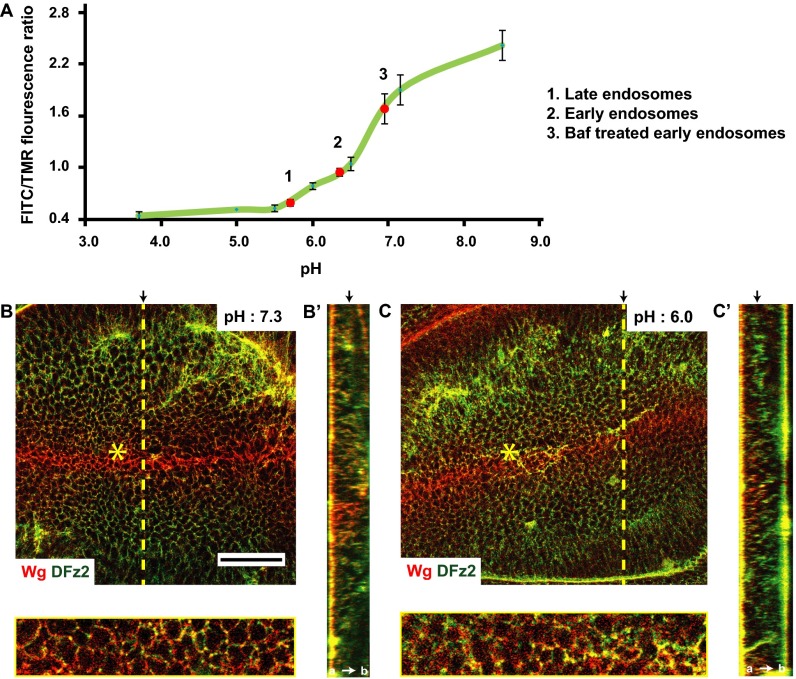
Endosomal acidification is important for Wg–DFz2 interaction (supplementary to Fig. 7). (A) Standard curve for endosomal pH showing the ratio of fluorescence of FITC/TMR from the ratiometric pH indicator (pH-sensitive FITC and pH-insensitive TMR conjugated Dex) localized to endosomes when clamped at different pH, as described in SI Materials and Methods. The pH of endosomes was measured by mapping the ratio of FITC/TMR fluorescence observed to the standard curve (red dots on the standard curve): early (10–15 min) endosomes (2), Baf-treated early endosomes (3), and late (30–35 min) endosomes (1) (used in Fig. 7). (B and C) Confocal sections of w1118 wing discs showing extracellular distribution of Wg (red) and DFz2 (green) when incubated on ice with buffers of pH 7.2 (B) and pH 6.0 (C). At pH 6.0, these proteins are observed as clusters and colocalize extensively across the wing disc. Regions near the yellow asterisk (B and C) are magnified (∼3×) in panels below. Such Wg and DFz2 clusters were evaluated for FRET in Fig. 7 E and F. B′ and C′ indicate YZ projection of pH 7.2 and pH 6.0 buffer-treated wing discs, respectively, along the planes indicated by dotted yellow line. Black arrows in B′ and C′ indicate the plane of the representative images. Images are background-subtracted with intensities appropriately scaled for representation. (Scale bar, 50 μm.)

