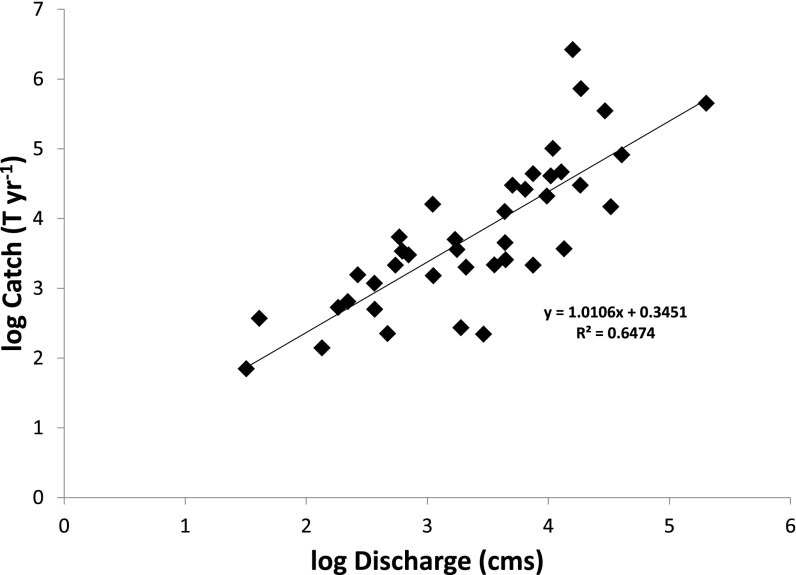
Fig. S1.
Calibration of catch distribution model. Annual catch (C) increases as a power function of mean annual discharge (Q), and both linearized and untransformed equations are indicated (R2 = 0.64). The relationship was fitted using reduced major axis regression to account for considerable uncertainty in both C and Q. Data are provided in Dataset S1.

