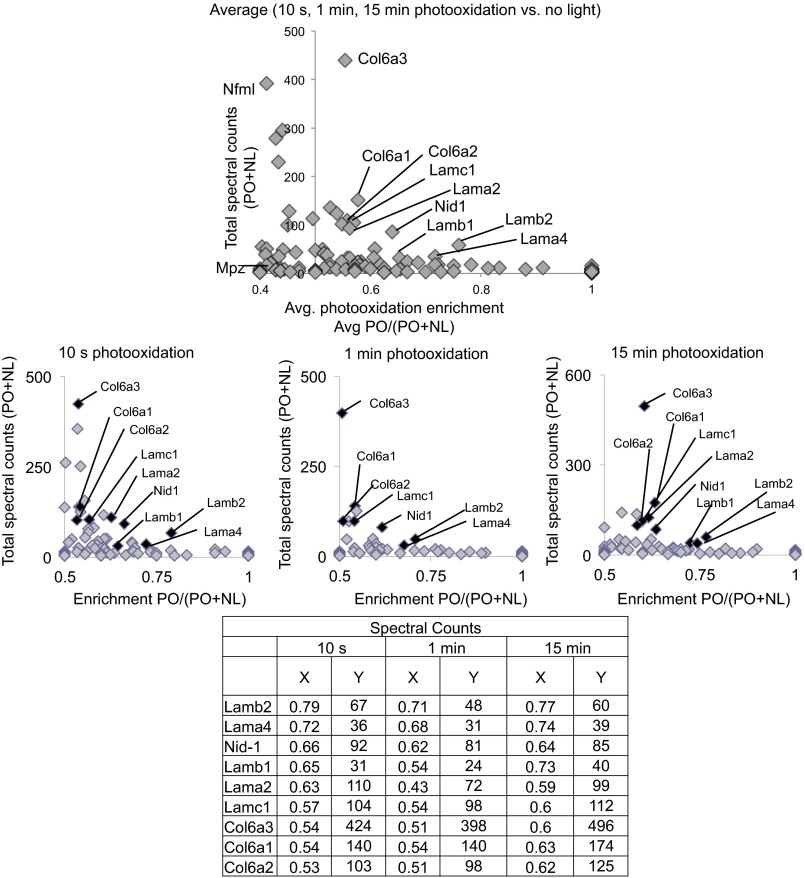
Fig. S2.
Ligand proximal photoxidation of NP41–MB enriches laminins after various photooxidation exposures. Shown are proteins identified as enriched by MS in nerve samples photooxidized with NP41–MB after light exposure (10 s, 1 min, or 15 min) versus NL control, plotted by average (Top) or individual light exposures (Middle). Spectral counts for each protein were summed [abundance (PO+NL)], and the fractions identified in the PO sample [enrichment PO/(PO+NL)] are plotted on the y and x axes, respectively. Proteins enriched in the PO compared with the NL control are shown on the right of the vertical axis at x = 0.5. Proteins with low total spectral counts (<30) were considered likely nonspecific background signal. Those identified as consistently enriched by light (x > 0.5) and with abundant spectral counts (y > 30) are highlighted in the graphs above and are identified with x and y values listed in the table. Proteins showing photooxidation-induced enrichment in multiple samples include laminin subunits, nidogen, and collagen VI subunits. Two abundant, nerve-specific proteins, neurofilament and myelin protein P0, were not enriched. Results are representative of independent replicate experiments.

