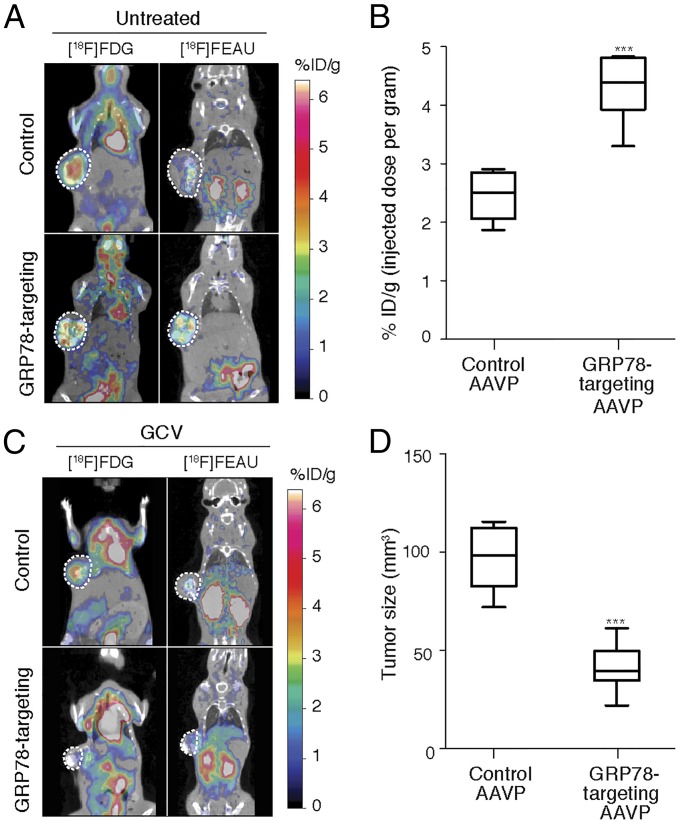
Fig. 6.
Ligand-directed theranostics of the MDA-PCa-118 PDX model. (A) PET/CT imaging of MDA-PCa-118b PDX-bearing mice administered intravenously with GRP78-targeting or control AAVP. The pseudocolor scale represents signal intensity of [18F]-FDG (metabolic activity) or [18F]-FEAU (HSVtk activity). ***P < 0.001 by two-tailed Student’s t test. (B) Quantification of HSVtk gene expression by micro-PET imaging of [18F]-FEAU substrate. ***P < 0.001 by two-tailed Student’s t test. (C) PET/CT imaging of MDA-PCa-118b PDX-bearing mice administered as in A, and 7 d later treated with GCV for 5 d. (D) Tumor sizes were assessed by caliper measurement. ***P < 0.01 by two-way ANOVA followed by Bonferroni’s test.

