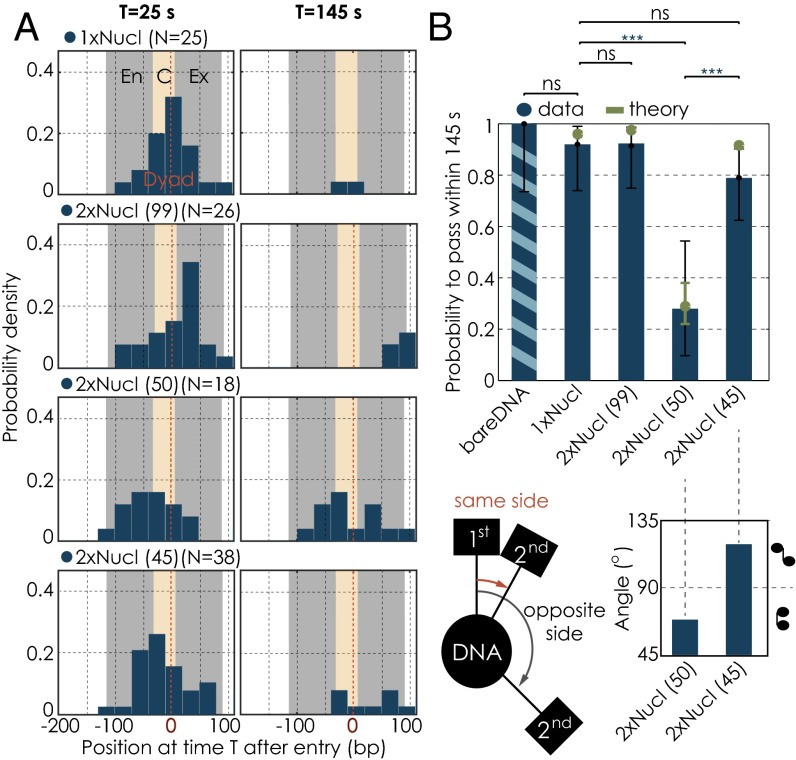
Fig. 4.
Change in passage probabilities in the presence of a second nucleosome as a function of internucleosomal distance. (A) Residence distributions of polymerases at 25 s (Left) and 145 s (Right) after entering the first nucleosomal region for the different conditions. Note that some enzymes are outside of the field of view. The gray bar illustrates the position of the nucleosome (En, entry; Ex, exit); the yellow area marks the central region (C, central). (B) Quantification of the passage probabilities through the first nucleosomal region. The passage probability refers to the capacity of a polymerase to pass the nucleosomal region within the cutoff time of 145 s. Note that our results are not sensitive to the precise value of the cutoff chosen to define passage probabilities (Fig. S4) nor is there a dependency on force for the range of forces applied (Fig. S5). Error bars represent the 95% CI. Experimental data are shown in blue; theory is shown in green. We used the Barnard’s exact test to calculate the P values for binary data sets. (C) (Left) Differences in nucleosomal orientations, where the two neighboring nucleosomes lie on the same or on opposite sides of the DNA. (Right) Angular distributions of the two neighboring nucleosomes for the 50- and 45-bp linker templates. Numbers of trajectories per condition as in Fig. 3. Two datasets are considered significantly different if the P value is below or equal to 0.05. Different P values are indicated as follows: ns, P > 0.05; ***P ≤ 0.001.

