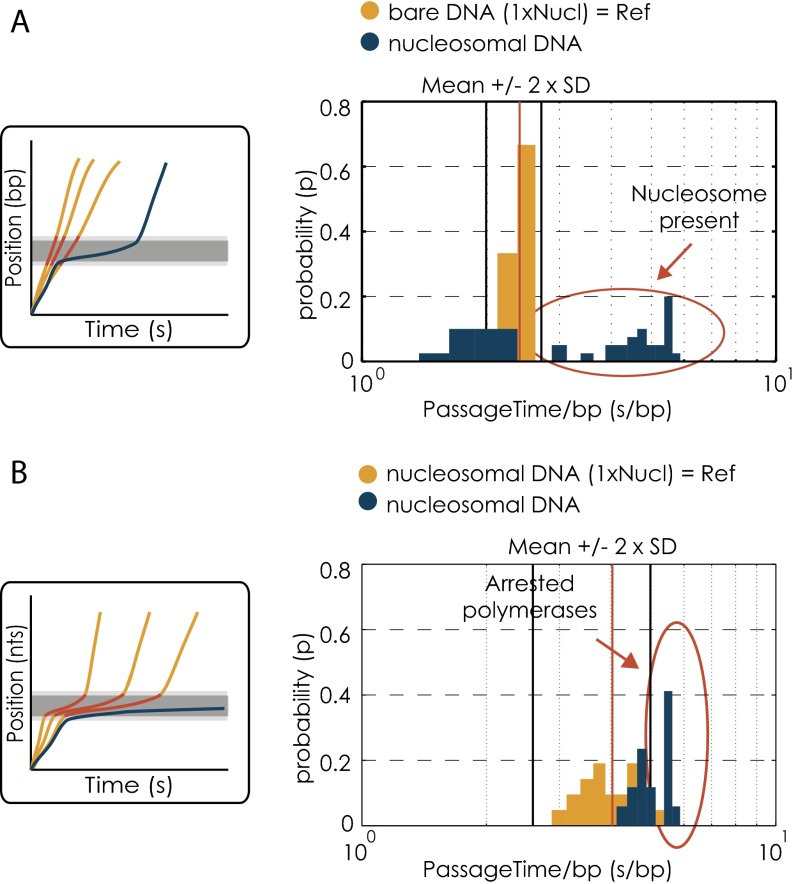
Fig. S3.
Data quality check for the presence of a nucleosome and sufficient nucleosomal residence time. (A) Quality check for presence of a nucleosome. (Left) Schematic of the data quality check method. The gray bar indicates the position of the nucleosome. The cutoff for determining the presence of a nucleosome was derived from transcription trajectories on bare DNA within the nucleosomal region (red). The blue line corresponds to a trajectory on a single nucleosomal template. (Right) The passage time distribution for the first nucleosome of the dinucleosomal template (50-bp linker) (blue). The yellow bars show the reference distribution of the bare DNA. All passage times longer than the cutoff (mean + 2 × SD = 11.2 + 2 × 1.9 s) are considered to result from the presence of a nucleosome. The x axis is in logarithmic scale. (B) Quality check for long enough residence times within the first nucleosomal region. (Left) Schematic of the data quality check method. The gray bar indicates the position of the nucleosome. The cutoff for selecting for sufficient nucleosomal residence time for all polymerases that did not make it through the nucleosomal region was derived from residence times of transcription trajectories on single nucleosomal templates within the nucleosomal region (red). The blue line represents a trajectory of a polymerase ending within the nucleosomal region. (Right) The passage time distribution for the first nucleosome of the dinucleosomal template (50-bp linker) for all runs that ended in the respective region (blue). The yellow bars show the reference distribution of the single nucleosomal template. All passage times longer than the cutoff (mean + 2 × SD = 66.04 + 2 × 39.68 s) are considered for further analysis. The x axis is in logarithmic scale.

