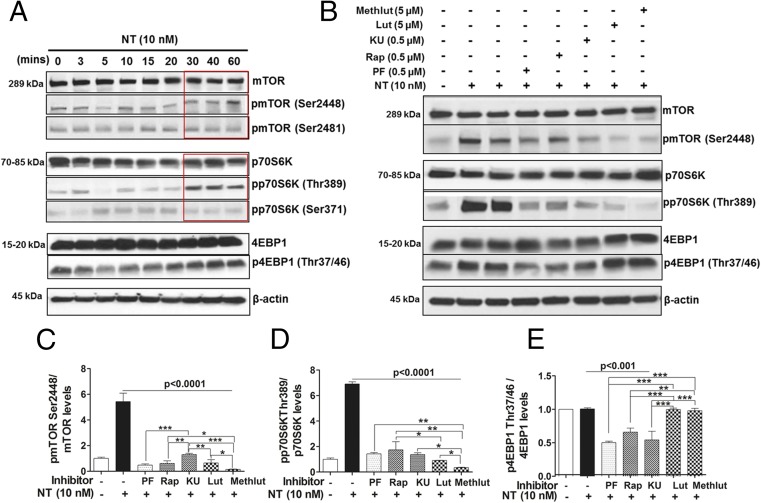
Fig. 5.
NT stimulates human microglia via activation of mTOR signaling, inhibited by luteolin (Lut) and methoxyluteolin (Methlut). (A) HM-SV40 (1 × 10⁶ cells) were stimulated with NT (10 nM) for 0–60 min. The total and phosphorylated levels of mTOR and mTOR substrates p70S6K (increase after 30 min of NT stimulation, red box) and 4EBP1 were analyzed by Western blot analysis, for which β-actin served as the loading control. (B) HM-SV40 were preincubated with the dual PI3K/mTOR inhibitor (PF, 0.5 μM) and the mTOR [rapamycin (Rap) or KU, 0.5 μM, 24 h] inhibitors or flavonoids (Lut and Methlut, 5 μM) in serum-free media overnight and, and then stimulated with NT (10 nM) for 30 min. The total and phosphorylated levels of mTOR and mTOR substrates were assessed by Western blot analysis. Results from densitometric analysis are presented as normalized phosphorylated-to-total protein levels of pmTORSer2448 and mTOR (C), pp70S6KThr389 and p70S6K (D), and p4EBP1Thr37/46 and 4EBP1 (E). All conditions were performed in triplicate for each dataset and were repeated three times (n = 3). Significance of comparisons was determined for stimulated cells and for those cells with inhibitors/flavonoids, as denoted by the horizontal lines (P < 0.001 or P < 0.0001), and also among each of the inhibitor/flavonoid treatments shown by the horizontal brackets and by the corresponding *P < 0.05, **P < 0.001, or ***P < 0.0001.

