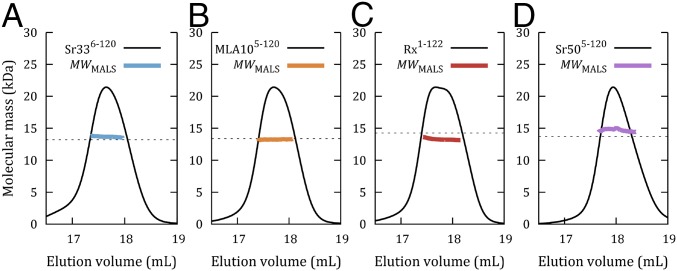
Fig. 2.
Molecular mass calculations based on SEC-MALS analysis for Sr336-120 (A), MLA105-120 (B), Rx1-122 (C), and Sr505-123 (D). For all proteins, solid black lines represent the normalized refractive index trace (arbitrary units, y axis) for proteins eluted from an in-line Superdex 200 10/300 column. Colored lines under the peaks correspond to the averaged molecular mass (right-hand y axis) distributions across the peak as determined by MALS (MWMALS). Dotted lines indicate the predicted molecular masses of a monomer. The average MWMALS values compared with predicted monomeric molecular mass values are 13.7/13.1 kDa for Sr336-120, 13.3/13.4 kDa for MLA105-120, 13.3/14.3 kDa for Rx1-122, and 14.7/14.1 kDa for Sr505-123.

