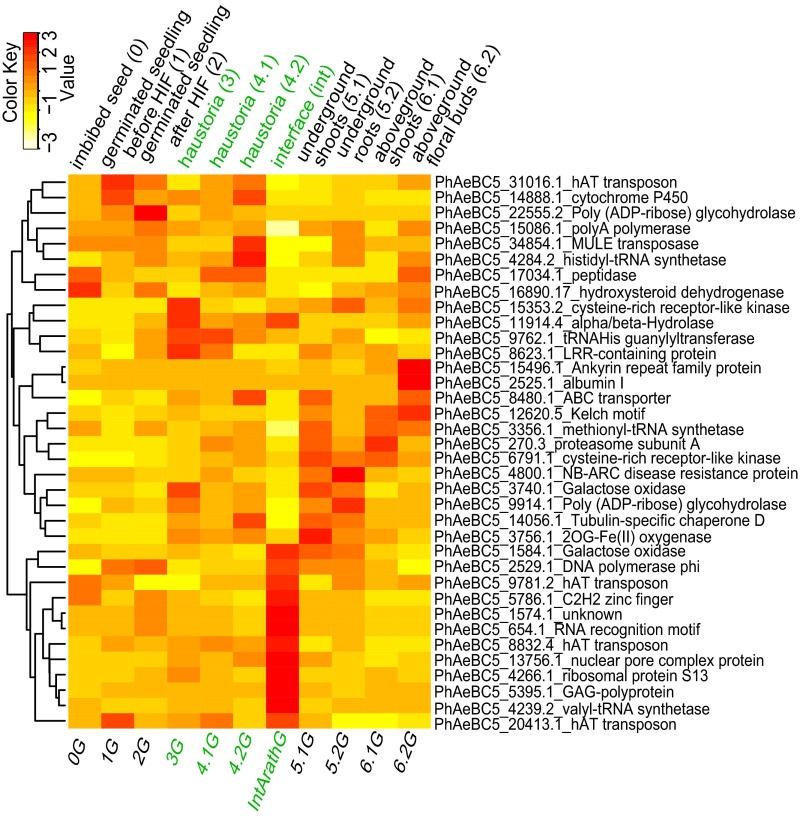
Fig. 4.
Heat map showing the expression of HGT transgenes in P. aegyptiaca. Expression is shown with FPKM-transformed z scores to ensure even signal intensity across stages. Rows represent HGT genes, with their identified domain shown on the right; columns represent stages (below) or tissues (above). Haustorial and interface tissues are colored in green. Genes were clustered on the left to show similarity.

