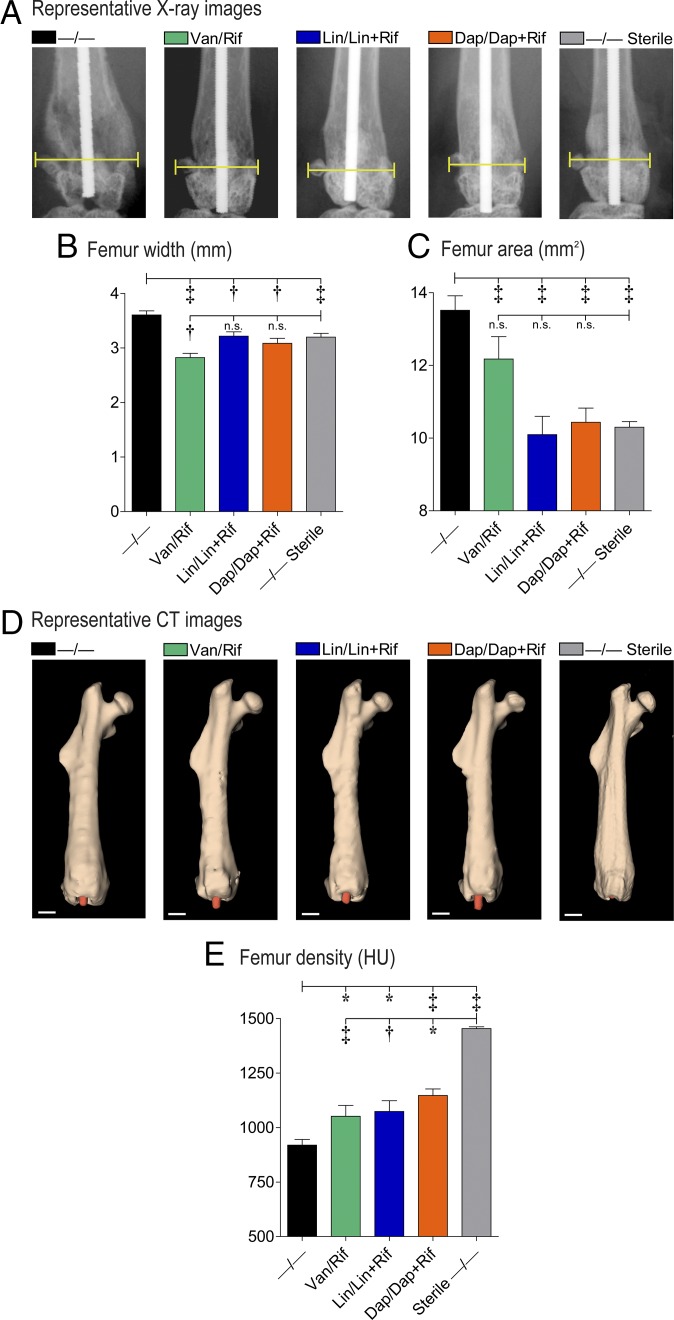
Fig. 6.
In vivo analysis of bone changes around the composite implant. Using an in vivo PJI model, high-resolution AP X-rays and µCT images of the distal femurs were obtained on day 14 after placement of the antibiotic composite coatings (antibiotics loaded into PLGA and PCL are denoted as shown in Fig. 1E) (n = 5 mice per group). (A) Representative X-ray images. (B) Mean femur width (millimeters ± SEM). (C) Mean femur area (square millimeters ± SEM). (D) Representative µCT images. (Scale bars, 1 mm.) (E) Mean femur density (HU ± SEM). *P < 0.05, †P < 0.01, ‡P < 0.001 for antibiotic-loaded coatings vs. −/− control coating (one-tailed unpaired Student’s t test).

