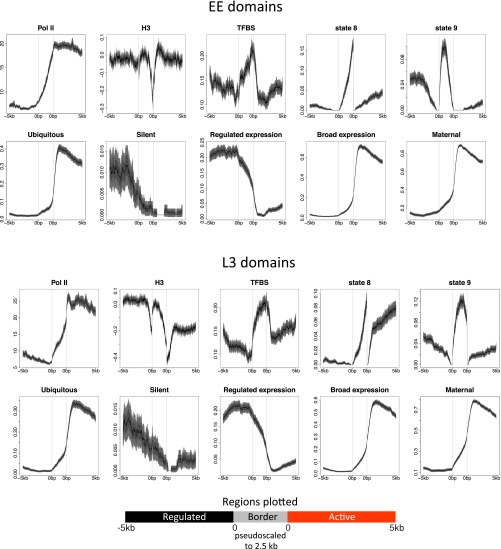
Fig. 2.
Properties of EE and L3 autosomal active, border, and regulated domains. Plots are centered and anchored at borders pseudoscaled at 2.5 kb, and show 5 kb into regulated domains (Left) and 5 kb into active domains (Right). Lines show mean signal, darker-filled areas show standard error, and lighter-filled areas are 95% confidence intervals. Gray vertical lines indicate edges of the border region.

