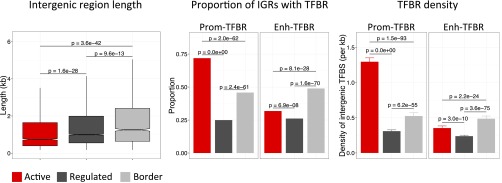
Fig. 5.
Intergenic regions at borders are long and enriched for enhancer TF binding sites. (A) Boxplots of intergenic region lengths in the specified regions; P values show significance of distribution differences tested using the Mann–Whitney U test. (B) Proportion of intergenic regions overlapping at least one TFBR of the indicated type; P values show differences in proportions tested using a z-test. (C) Density of Prom-TFBR, and Enh-TFBR per kilobase of intergenic region; P values show significance of distribution differences tested using the Mann–Whitney U test.

