Significance
Environmental and nutritional cues are crucial to determine genomic responses. They generally proceed through modulation of epigenetic mechanisms. Nuclear sirtuin 1 (SIRT1) is a well-known epigenetic modifier, because it deacetylates histones, and nutrient sensor, because its enzymatic activity is coupled to hydrolysis of NAD+. Compartmentalization of NAD+ metabolism makes it difficult to predict the pace of NAD+-dependent reactions in cells. Here, we use nonlinear optics in live cells to define subnuclear distribution of free and bound NADH, which determines local enzymatic activity. We define subnuclear dynamics of SIRT1 and establish a biophysical signature for SIRT1 activity in live cells. These findings have far-reaching implications, because they describe unique aspects of SIRT1 activity and delineate subnuclear territories of metabolic cues.
Keywords: sirtuins, NAD+, epigenetics, FLIM, spectroscopy
Abstract
Sirtuin 1 (SIRT1) is an NAD+-dependent deacetylase that functions as metabolic sensor of cellular energy and modulates biochemical pathways in the adaptation to changes in the environment. SIRT1 substrates include histones and proteins related to enhancement of mitochondrial function as well as antioxidant protection. Fluctuations in intracellular NAD+ levels regulate SIRT1 activity, but how SIRT1 enzymatic activity impacts on NAD+ levels and its intracellular distribution remains unclear. Here, we show that SIRT1 determines the nuclear organization of protein-bound NADH. Using multiphoton microscopy in live cells, we show that free and bound NADH are compartmentalized inside of the nucleus, and its subnuclear distribution depends on SIRT1. Importantly, SIRT6, a chromatin-bound deacetylase of the same class, does not influence NADH nuclear localization. In addition, using fluorescence fluctuation spectroscopy in single living cells, we reveal that NAD+ metabolism in the nucleus is linked to subnuclear dynamics of active SIRT1. These results reveal a connection between NAD+ metabolism, NADH distribution, and SIRT1 activity in the nucleus of live cells and pave the way to decipher links between nuclear organization and metabolism.
Sirtuins (SIRTs) are a conserved family of deacetylases that target a variety of proteins located in virtually all cellular compartments (1). Deacetylation by SIRTs may control many functional aspects of target proteins (2). Because SIRT deacetylase activity depends on the energy carrier NAD+, these enzymes are thought to operate as cellular metabolic sensors. In addition, because histones are targeted by nuclear SIRT, these enzymes could link variations in cellular metabolism to chromatin function.
There are seven mammalian SIRTs (SIRT1 to SIRT7) with distinct subcellular locations. SIRT2 is mainly cytoplasmic; SIRT3, SIRT4, and SIRT5 are found in the mitochondrial compartment; and SIRT1, SIRT6, and SIRT7 are located in the cell nucleus (1). In mammals, SIRT1 contributes to development and protects from metabolic and cardiovascular disease, neurodegeneration, and cancer (3). SIRT1 has been reported to promote healthy aging and regulate lifespan (4, 5). At the cellular level, SIRT1 regulates lipid and glucose homeostasis, apoptosis, DNA repair, and mitochondrial function. Variations in NAD+ levels control SIRT1 activity (6–9), a relevant finding in the regulation of circadian rhythms (10). Circadian rhythms in NAD+ levels have been observed (11, 12), which lead to fluctuating SIRT1 deacetylase activity (9) that, in turn, results into cyclic acetylation of specific SIRT1 targets (6, 9, 13). SIRT1 and SIRT6 segregate circadian metabolism by driving transcription of a differential subset of circadian genes (14). SIRT6 is a chromatin-bound protein that was first characterized as a regulator of genome stability (15). The other nuclear SIRT, SIRT7, appears to be highly localized in the nucleolus and possibly involved in Pol-I–dependent transcription (16), and it has been shown to regulate lifespan, aging-associated stem cell and tissue maintenance, and metabolic homeostasis (17, 18). All together, these findings suggest that SIRTs could be targeted in therapeutic strategies for the treatment of a number of metabolic and age-related diseases (19, 20).
Two-photon fluorescence lifetime microscopy (2P-FLIM) is becoming increasingly used to image the metabolite NADH in live cells and tissues in a label-free and noninvasive way. Lifetime measurements from fluorescent NADH distinguish free NADH and subpopulations of protein-bound NADH, whereas NAD+ is not fluorescent (21). NADH 2P-FLIM cellular map provides sensitive measurements of local activity associated with NADH metabolism (22–28). Fluorescence correlation spectroscopy analyzes the fluctuation of fluorescent molecules in a small illuminated spot, providing spatiotemporal maps of concentration, interaction, or diffusion parameters of molecules (29–33).
In this study, we used 2P-FLIM and fluctuation techniques to decipher the dynamics of NADH metabolism in live cells (details are in SI Introduction to the Techniques). Both 2P-FLIM and fluctuation-based diffusion measurements have pixel resolution to determine SIRT1 dynamics and related NADH metabolism. Indeed, the fluorescence correlation spectroscopy technique that we used for SIRT1 diffusion measurements at each pixel of the image has unprecedented spatial resolution (32).
Our findings show that SIRT1 dictates the distribution of NADH species in the nucleus. Using pharmacological and genetic manipulations, we show that this balance depends on SIRT1 activity. Moreover, nuclear NAD+ metabolism directs intranuclear dynamics of SIRT1. High levels of NAD+ are associated with slow-diffusing SIRT1 at specific inner areas of the nucleus. Altogether, our data reveal that intranuclear NADH distribution is responsive to SIRT1 enzymatic activity, which conversely dictates the dynamics and distribution of SIRT1. These findings point to functional connections between metabolism and nuclear organization.
SI Introduction to the Techniques
In this study, we have measured the free to bound NADH ratio using the phasor approach to fluorescence lifetime imaging (24, 34, 36). The free and bound NADH forms can be excited with two-photon excitation at 740 nm. The autofluorescence emitted in cells after this excitation originates from NADH (free and bound) and FAD. However, as FAD fluorescence is shifted toward long wavelength and by using proper optical filters (460/80 nm), the fluorescence of NADH can be readily separated from the FAD contribution. The analysis of the fluorescence lifetime decay at each pixel was carried out following the phasor approach to the FLIM. The intensity decays collected at each pixel of the image were transformed to the Fourier space, and the phasor coordinates were calculated (SI Materials and Methods). Here, g and s are the x and y coordinates of the phasor plot, respectively. These axes of the phasor plot represent the transformed fluorescence lifetime decay to the Fourier space. The g and s coordinates are plotted in the phasor plot in a way that the fluorescence decay from each individual pixel is transformed to a point in the phasor plot. The separation between free and bound NADH is achieved based on the different fluorescence lifetime of the two species. Free NADH has a fluorescence lifetime of 0.4 ns, and bound NADH (when bound to lactate dehydrogenase) has a lifetime of 3.4 ns (57). When converted to phasor plot, the positions of these two points are on the semicircle and at distinctively different positions. The free NADH is close to s = 0.2 and g = 0.9, and bound is close to s = 0.4 and g = 0.2. NAD+ is not fluorescent and thus, cannot be detected using fluorescence microscopy. However, the ratio of NAD+ to NADH is related to free and bound NADH. This relationship is used to measure metabolism in cells (22). The autofluorescence intensity is indicative of total amount of NADH. However, it is complicated by the fact that bound NADH is much more fluorescent compared with free NADH, and the quantum yield is eight times larger (58). Thus, the autofluorescence intensity image is complicated by the fact that the free NADH and the bound NADH contribute differently to the intensity. Instead, the fluorescence lifetime is specific to a particular molecular species, so that the ratio free/bound NADH can be measured at each pixel. The phasor approach of analyzing lifetime is thereby a unique way to determine the ratio of free to bound NADH using the lifetime and the property of linear combination in phasor space.
Fluorescence fluctuation spectroscopy was first introduced by Magde et al. in 1972 (59). Then, fluorescence correlation spectroscopy was introduced to study diffusion of molecules in a solution in 1974 (31). However, to measure diffusion in cells, RICS was introduced in 2008 (60), and the phasor fluorescence correlation spectroscopy was introduced in 2014 (32). The basic principle of this technique involves studying fluctuation in the fluorescence intensity caused by the diffusion of the fluorophore into a very small illuminated spot where the molecule becomes fluorescent. The intensity of the fluorescence changes because of the variations in the number of molecules (concentration) in a small detection volume (about 1fL) and their relative position in the nonhomogeneous excitation volume. Changes in these quantities, number, and position are dependent on diffusion, and thus, by analyzing the fluctuations in the intensity, diffusion parameters can be obtained. Details of the RICS and phasor fluorescence correlation spectroscopy are described in detail in SI Materials and Methods. These two methods were used to measure the diffusion of SIRT1-EGFP.
Results
Linking SIRT1 to the Subnuclear Distribution of NADH Species.
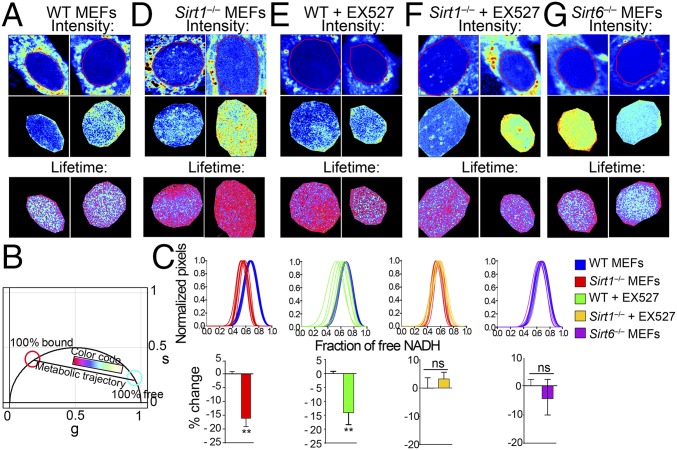
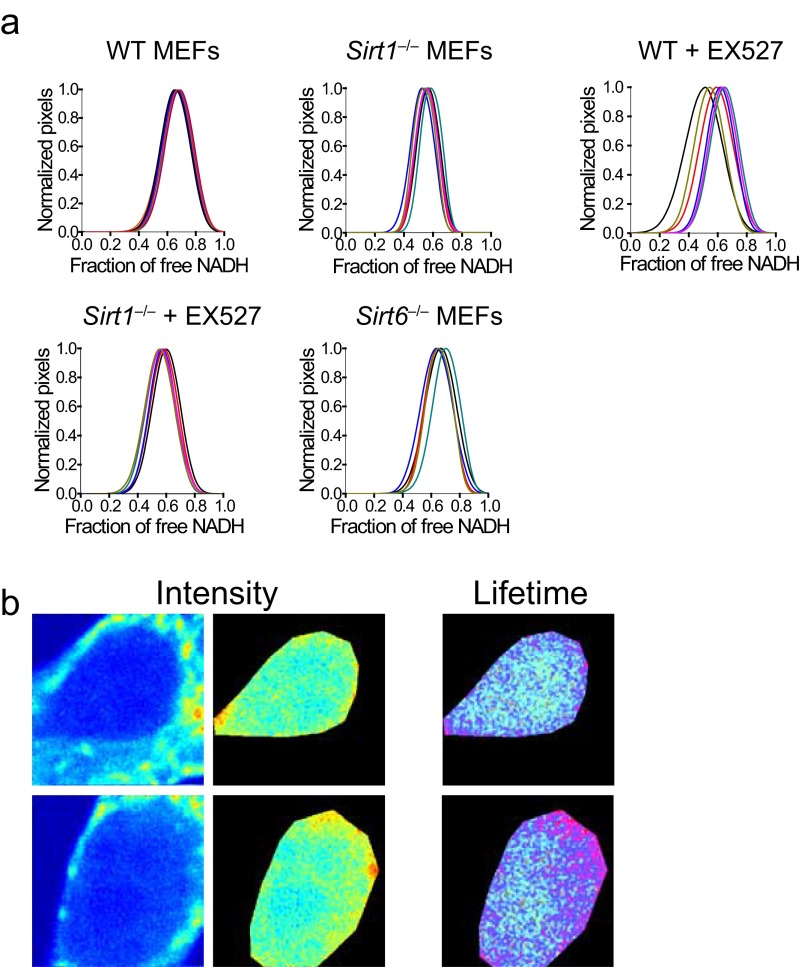
Phasor fluorescence lifetime microscopy (FLIM) analysis proceeds by Fourier transformation of the lifetime data, which allows direct quantification at each pixel of the free and bound NADH ratio (34–36). Metabolic transitions and phenotypes in living single cells have been previously determined using the phasor approach to FLIM, including identification of biological processes, such as cell proliferation and differentiation, tumorigenesis, and aging (22, 24, 27, 37, 38). Because biochemical reactions depending on NADH occur at different rates in distinct subcellular compartments, the measurement of NADH free/bound ratio provides a weighted mean of the enzymatic activities in the cell when combined with local NADH fluorescence intensity. For example, NADH fluorescence intensity in the mitochondrial compartment shows maximal brightness, indicating that mitochondrial NADH levels are higher there than in other compartments (Fig. 1A). This effect is not surprising, because a large part of mitochondrial metabolism on oxidoreductase enzymes uses NADH as a cofactor to catalyze reactions. Concomitantly, the intensity from NADH in the cell nucleus is considerably lower than in other intracellular compartments (39, 40) (Fig. 1A), suggesting a compartmentalized metabolism for NADH cofactors. The brightness from mitochondria can influence the FLIM image, even if they appear at different z planes than the nucleus in the two-photon excitation images. For this reason, contributions from these pixels were not included by creating a mask around the nucleus; hence, only fluorescence from nuclear NADH was monitored (Fig. 1 and Fig. S1). Because the contrast in the images acquired by FLIM depends on the fluorescence lifetime instead of intensity of the fluorophore, nuclear NADH lifetime reveals details about microenvironments of free and bound NADH at submicrometer resolution (21) as shown in the color-coded images of free/bound NADH values in Fig. 1B. When analyzing mouse embryonic fibroblasts (MEFs), we found that NADH subspecies are distributed in distinct nuclear territories, with bound NADH located to the nuclear periphery, whereas free NADH concentrates in the nuclear interior (Fig. 1A and Fig. S1A). Similar results were confirmed in a human diploid fibroblast cell line (Fig. S1B). These findings are in keeping with the presence of nuclear metabolic territories as recently predicted (41, 42) and prompted us to investigate whether nuclear NADH distribution could be influenced by SIRT1. Importantly, the Km of SIRT1 for NAD+ seems to fall into the physiological range of NAD+ bioavailability in the nucleus (43).
Fig. 1.
Nuclear territories for metabolic states in MEFs. (A) Intensity (before and after masking) and lifetime (FLIM) images for WT MEFs. Two representative images are shown (n = 10–15 single cells). Triplicate experiments were performed. (B) Phasor plot shows the color scale used in this study to visualize metabolic trajectories or the fraction of free/bound NADH in FLIM images. (C) Histograms in Upper show comparative analyses by overlapping the fractional free NADH distributions from two different populations of cells as indicated in the color legend. The fraction of free NADH is represented in the x axis, where 1 = 100% free NADH; n = 10–15 single cells per experiment. Graphs in Lower represent the percentage change on the fraction of free NADH for each comparative analysis from the corresponding histogram in Upper. Data were normalized for WT or nontreated condition = 0. Means ± SEM of three independent experiments are presented. ns, Not significant by two-tailed MWU. **P < 0.01 by two-tailed MWU. (D–G) Intensity and lifetime (FLIM) images from (D) Sirt1−/−MEFs, (E) WT MEFs, and (F) Sirt1−/−MEFs treated with EX527 (50 μM during 20 h) and (G) Sirt6−/−MEFs. Two representative images are shown (n = 10–15 single cells). Each experiment was performed in triplicate.
Fig. S1.
Nuclear territories for metabolic states. (A) Complementary to Fig. 1. Individual fractions showing the distribution of free NADH in the cell nucleus of single MEFs. Each line represents the data for one single cell; n = 10–15 single cells. (B) Intensity and FLIM (lifetime) images from the nucleus of a human diploid fibroblast cell line. Two representative images are shown; n = 15 single cells.
We compared the relative fractions of free (cyan/white) and bound (magenta) NADH in WT and Sirt1−/− MEFs (Fig. 1 C and D and Fig. S1A). The fraction of bound NADH is significantly higher in Sirt1−/− MEFs compared with in WT MEFs (Fig. 1 C and D) [P < 0.001, Mann–Whitney u test (MWU)]. This difference is not an adaptive effect to chronic ablation of SIRT1 as shown by using the selective inhibitor EX527 (44) (Fig. 1E and Fig. S1A). Strikingly, acute inhibition of SIRT1 is sufficient to reorganize NADH metabolism in the nucleus, potentiating the binding of nuclear NADH to proteins (Fig. 1 D and E) (P < 0.001, MWU). As expected, EX527 treatment on Sirt1−/− MEFs had no significant effect (Fig. 1 C and F) (P > 0.05, MWU). To investigate whether this effect is solely attributed to SIRT1, we used MEFs carrying a genetic deletion of SIRT6. Free/bound FLIM analyses in the nucleus from sirt6−/− MEFs show an overall metabolic state and distribution comparable with WT MEFs (Fig. 1 C and G) (P > 0.05, MWU). Our data show that NADH has a nonrandom distribution in the nucleus and that nuclear NADH metabolism is specifically associated with SIRT1.
Metabolic Transitions in the Cell Nucleus on SIRT1 Activation.
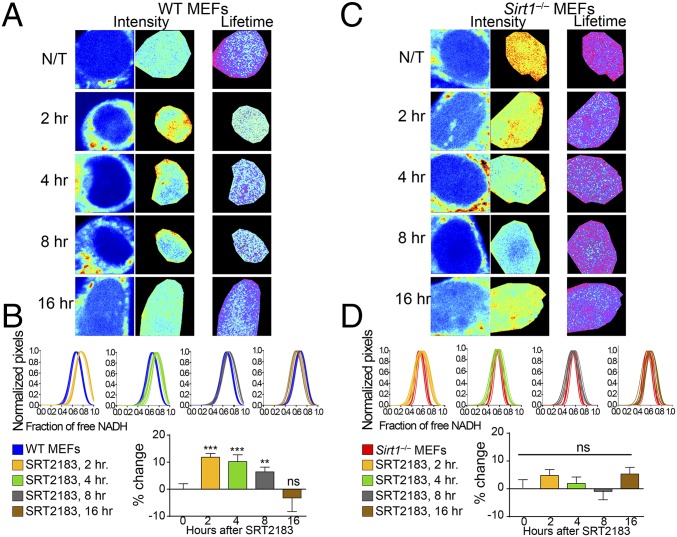
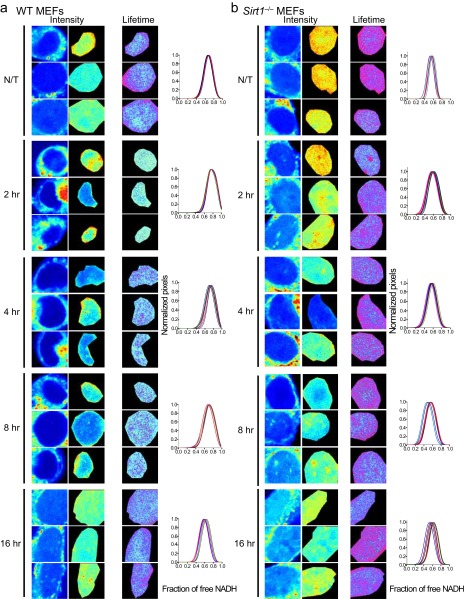
Next, we sought to investigate if activation of SIRT1 with small molecule activators could affect nuclear NADH distribution. We performed a time course study treating cells with the specific SIRT1 activator SRT2183 (45) for 2, 4, 8, and 12 h (Fig. 2 A and B and Fig. S2A). Interestingly, metabolic transitions of NADH species appeared remarkably robust after 2-h treatment, showing a very significant fraction of NADH displaced toward the free form compared with untreated cells (Fig. 2 A and B) (P < 0.001, MWU). This effect is sustained after 4- and 8-h treatment, whereas free/bound NADH distribution is progressively recovered after 16-h treatment, probably because of an effect on dilution or metabolism of the drug (Fig. 2 A and B and Fig. S2A). As expected, no or little effect of SRT2183 was observed in Sirt1−/− MEFs (Fig. 2 C and D and Fig. S2B) (P > 0.05, MWU), further confirming the specificity of SRT2183 triggering SIRT1 activation (45, 46). These data indicate that SIRT1 prompts significant redistribution of nuclear NADH.
Fig. 2.
Metabolic transitions in the cell nucleus depend on SIRT1 activity. (A) Intensity and FLIM (lifetime) images from untreated (N/T) WT MEFs or those treated with SRT2183 (10 μM) for 2, 4, 8, and 16 h as indicated. (B) Histograms in Upper show comparative analyses by overlapping the fractional free NADH distributions from nontreated single WT MEFs (blue lines) and single WT MEFs treated with SRT2183 (10 μM). The fraction of free NADH is represented in the x axis, where 1 = 100% free NADH; n = 10–15 single cells per experiment, and each line represents the distribution of the fraction of free NADH for each single cell. Graphs in Lower depict the percentage change on the fraction of free NADH. Data were normalized for nontreated WT MEFs = 0. Means ± SEM of three independent experiments are presented. **P < 0.01 by two-tailed MWU; ***P < 0.001 by two-tailed MWU. (C) Intensity and FLIM (lifetime) images from N/T Sirt1−/− MEFs or those treated with SRT2183 (10 μM) for 2, 4, 8, and 16 h as indicated. (D) Histograms in Upper show comparative analyses by overlapping the fractional free NADH distributions from nontreated single Sirt1−/− MEFs (red lines) and single Sirt1−/− MEFs treated with SRT2183 (10 μM). The fraction of free NADH is represented in the x axis, where 1 = 100% free NADH; n = 10–15 single cells per experiment, and each line represents the distribution of the fraction of free NADH for each single cell. Graphs in Lower depict the percentage change on the fraction of free NADH. Data were normalized for nontreated Sirt1−/− MEFs = 0. Means ± SEM of three independent experiments are presented. ns, Not significant by two-tailed MWU.
Fig. S2.
Metabolic transitions in the cell nucleus on SIRT1 activation. Intensity and FLIM (lifetime) images in the nucleus from untreated (N/T) (A) WT MEFs and (B) Sirt1−/− MEFs or those treated with SRT2183 (10 μM) for 2, 4, 8, and 16 h as indicated. Three single cells are shown from n = 10–15 cells. Histograms show single-cell NADH lifetime distributions for each experiment. The fraction of free NADH is represented in the x axis, where 1 = 100% free NADH; n = 10–15 single cells per experiment, and each line represents the distribution of the fraction of free NADH for each single cell.
Metabolic Control of Nuclear NADH Distribution by the NAD+ Salvage Pathway.
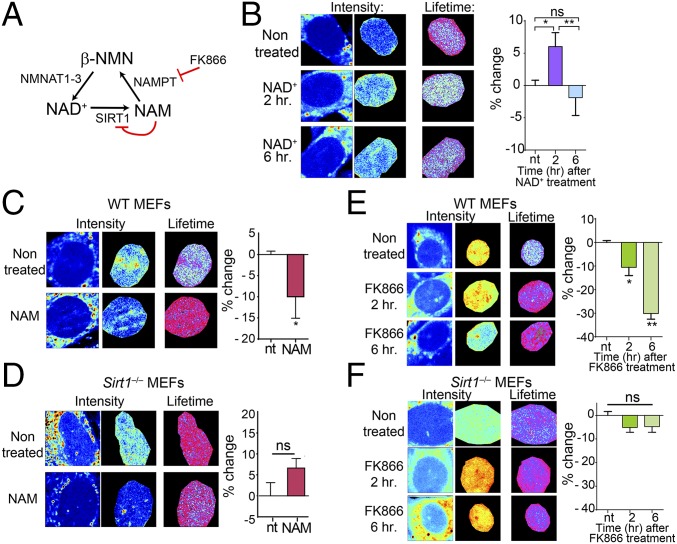
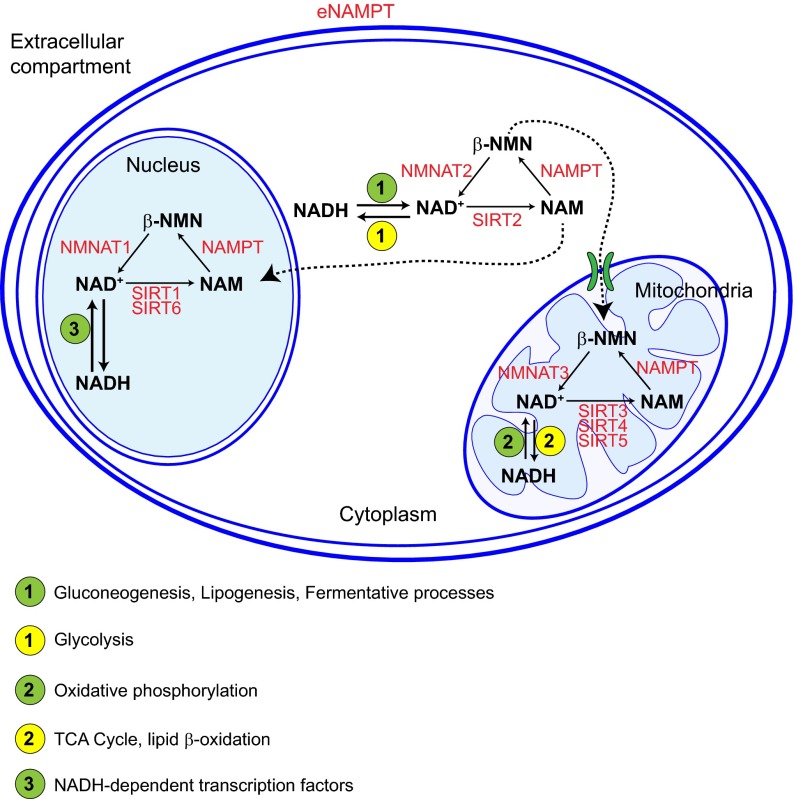
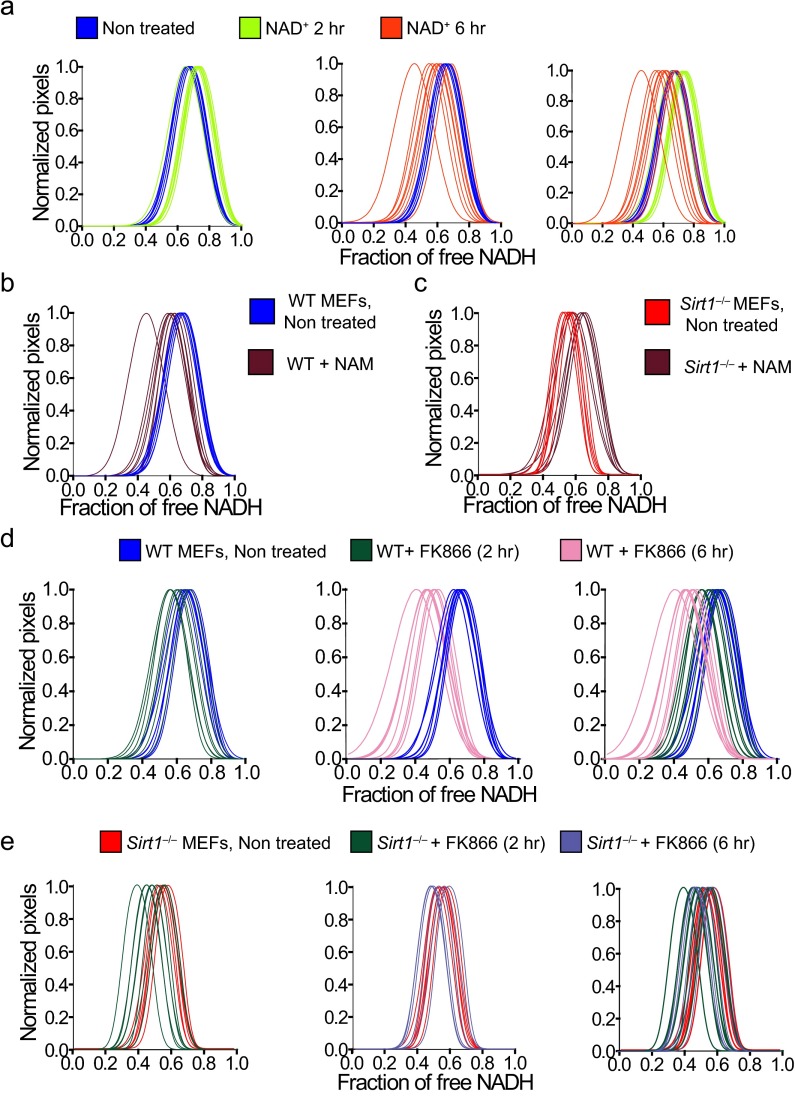
NAD+ metabolism is compartmentalized, because this metabolite cannot diffuse through membranes (21). NAD+ bioavailability is subjected to the salvage pathway, which recycles NAD+ from the end product of NAD+-consuming enzymes, nicotinamide (NAM) (47). NAM is converted to β-NMN in a rate-limiting step catalyzed by the enzyme nicotinamide phosphoribosyltransferase (NAMPT) (47) (Fig. 3A and Fig. S3). NMN recycles NAD+ through the adenylyltranferase enzymes NAM mononucleotide adenylyltransferase 1–3, which have distinct subcellular locations (Fig. 3A and Fig. S3). To investigate the influence of the NAD+ salvage pathway in nuclear NADH territories, we first investigated the effect of NAD+ treatment (Fig. 3B and Fig. S4A). After 2-h treatment, the fraction of free NADH increases, and 6 h after the treatment, cells recover the basal status, suggesting the activation of compensatory mechanisms (Fig. 3B and Fig. S4A). Next, we treated cells with NAM (Fig. 3 A and C). Interestingly, most of the NADH was found in its bound state after this treatment, whereas nuclear territories of free NADH tend to disappear (Fig. 3C and Fig. S4B). Because NAM is a potent inhibitor of SIRT1 activity, it has been postulated that low levels of NAM are beneficial for increasing NAD+ and SIRT activity, whereas high levels of NAM might be deleterious. Along this line, the Km of NAMPT is rather low (47), indicating that this enzyme might be fully operational under physiological conditions, and increased amounts of NAM may not substantially enhance its activity. Thereby, NAM treatment has an effect on nuclear metabolism comparable with SIRT1 inhibition (Figs. 1E and 3C and Fig. S4B) or its genetic deletion (Figs. 1C and 3C and Fig. S4B). Treatment of Sirt1−/− MEFs with NAM also showed significant effect, probably because of the dual function of NAM as NAD+ precursor and SIRT1 inhibitor (Fig. 3D and Fig. S4C).
Fig. 3.
NAD+ salvage pathway determines metabolic transitions in the cell nucleus. (A) Schematic representation of the NAD+ metabolic salvage pathway. NMNAT1–3, nicotinamide mononucleotide adenylyltransferase 1–3. (B–F) Intensity and FLIM (lifetime) images from (B, C, and E) WT MEFs and (D and F) Sirt1−/− MEFs nontreated or treated with (B) NAD+ (2 mM), (C and D) NAM (10 mM, 16 h), and (E and F) FK866 (10 nM). Histograms in Right show comparative analyses in the percentage change on the fraction of free NADH. Data were normalized for nontreated MEFs = 0. Means ± SEM of three independent experiments are presented. ns, not significant by two-tailed MWU; nt, nontreated. *P < 0.05 by two-tailed MWU; **P < 0.01 by two-tailed MWU.
Fig. S3.
NAD+ metabolism is compartmentalized. Schematic representation of the location of the different components of the NAD+ salvage pathway in different cellular compartments. The main metabolic pathways involved in the interconversion between the reduced and oxidized forms of NADH are indicated for each cellular compartment. NMNAT1–3, nicotinamide mononucleotide adenylyltransferase 1–3.
Fig. S4.
NAD+ salvage pathway determines metabolic transitions in the cell nucleus. Histograms showing comparative analyses by overlapping the NADH lifetime distributions from (A, B, and D) WT MEFs and (C and E) Sirt1−/− MEFs nontreated or treated with (A) NAD+ (2 mM), (B and C) NAM (10 mM), and (D and E) FK866 (10 nM). The fraction of free NADH is represented in the x axis, where 1 = 100% free NADH; n = 10–15 single cells per experiment, and each line represents the distribution of the fraction of free NADH for each single cell.
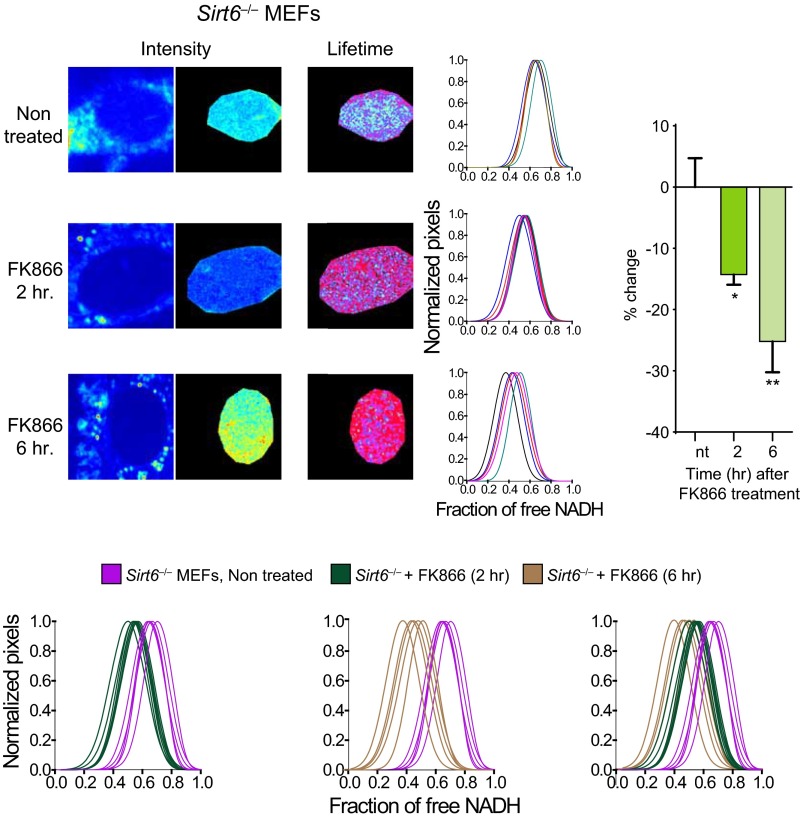
Based on these findings, we hypothesized that altering the flux of the NAD+ salvage pathway would have similar consequences. The small molecule FK866 is a specific and potent NAMPT inhibitor (Fig. 3A) (48) that lowers cellular NAD+ levels (9, 48). Accordingly, 2-h treatment with FK866 leads to significant increase in nuclear-bound NADH (Fig. 3E and Fig. S4D) (P < 0.05, MWU test), an effect further potentiated after 6-h treatment (Fig. 3E and Fig. S4D) (P < 0.01, MWU) and reaching a fraction of bound NADH comparable with that of Sirt1−/− MEFs. Interestingly, there is no effect in the distribution of NADH by FK866 treatment in the nucleus of Sirt1−/− MEFs (Fig. 3F and Fig. S4E) (P > 0.05, MWU), whereas Sirt6−/− MEFs are responsive to the treatment (Fig. S5). Altogether, our data indicate that nuclear distribution and state of NADH metabolism largely rely on SIRT1 and that fluctuations in NAD+ nuclear bioavailability have similar consequences as manipulating SIRT1 activity.
Fig. S5.
The nuclear SIRT SIRT6 does not control NADH metabolic transitions in the nucleus. Intensity and FLIM (lifetime) images from nontreated Sirt6−/− MEFs or those treated with the NAMPT-specific inhibitor FK866 (10 nM) during 2 or 6 h as indicated. Histograms in Right of the images show single-cell NADH lifetime distributions for each experiment. The fraction of free NADH is represented in the x axis, where 1 = 100% free NADH; n = 10–15 single cells per experiment, and each line represents the distribution of the fraction of free NADH for each single cell. The overlapping experiments for comparative analyses are depicted in Lower. The bar histogram shows comparative analyses in the percentage change on the fraction of free NADH. Data were normalized for nontreated Sirt6−/− MEF = 0. Means ± SEM of three independent experiments are presented. ns, Not significant by two-tailed MWU; nt, nontreated. *P < 0.05 by two-tailed MWU; **P < 0.01 by two-tailed MWU.
Nuclear Dynamics and Subnuclear Distribution of Differentially Active SIRT1 Populations.
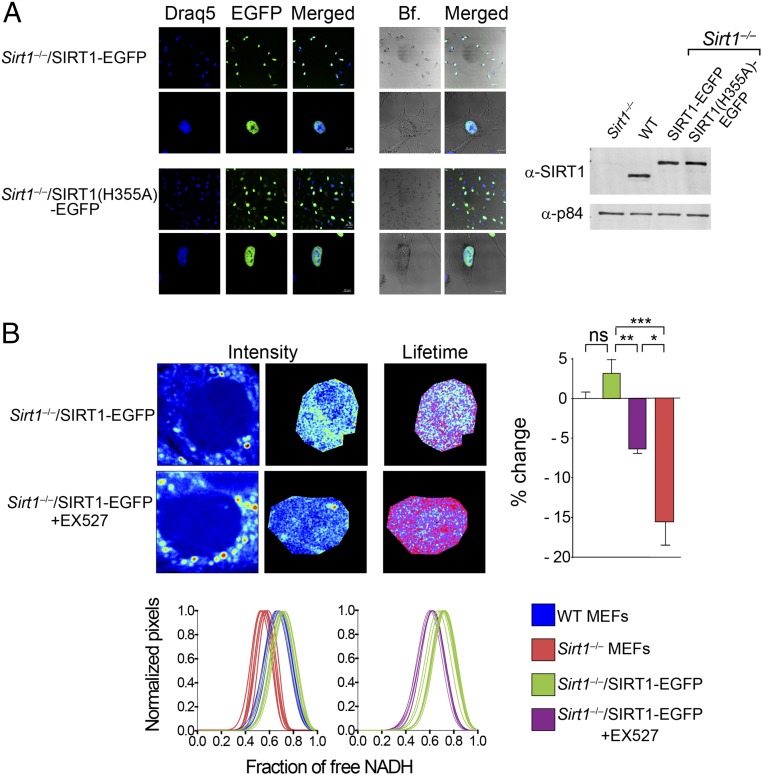
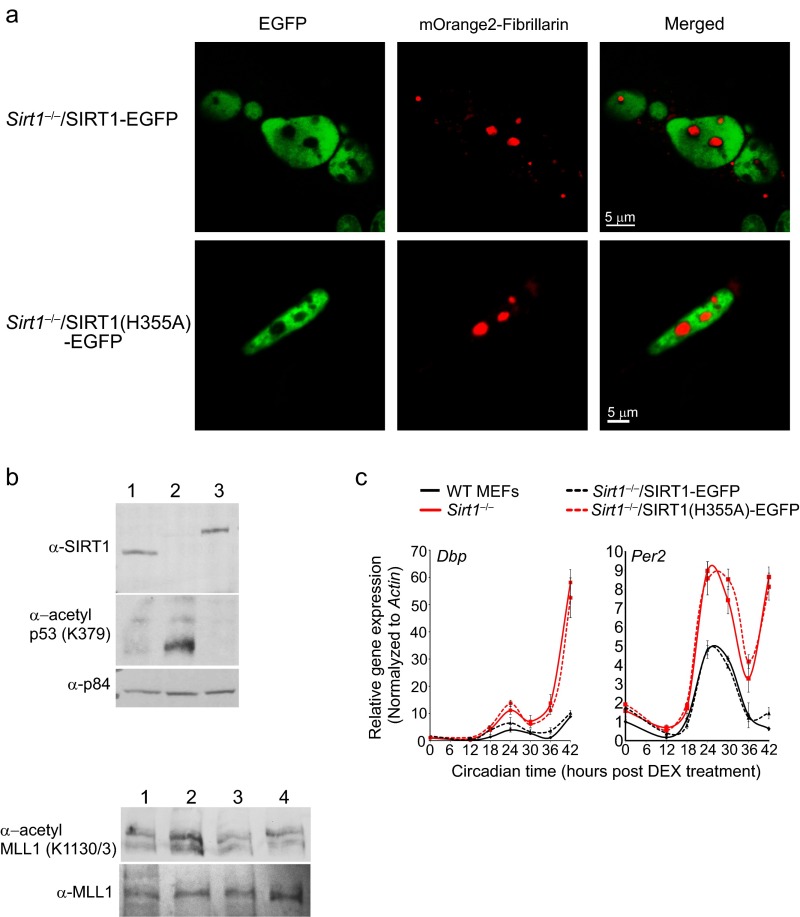
In vitro studies indicate that enzymatic inactivation of SIRT1 results in a decreased affinity for its substrates, whereas its activation promotes lowering the Km for substrates (46, 49, 50). We sought to explore whether SIRT1 binding to substrates could be modulated by its activation through nuclear metabolism in living cells. We generated Sirt1−/− clonal cell lines that stably express either SIRT1-EGPF or the deacetylase inactive isoform SIRT1(H355A)-EGFP. As shown in Fig. 4A, the location of fluorescent versions of SIRT1 was mostly restricted to the nucleus, depicting a homogenous distribution that excludes the nucleolus (Fig. S6A). Expression of SIRT1-EGFP in Sirt1−/− cells rescues the acetylation levels of several targets and specific metabolic-related patterns of gene expression (Fig. S6B). Importantly, the expression of SIRT1-EGFP in the Sirt1−/− background fully recovers the nuclear NADH lifetime distribution of WT MEFs (part of the data in Fig. 4B is the data from Fig. 1), being also sensitive to inhibition by EX527 (Fig. 4B).
Fig. 4.
Expression of catalytically active SIRT1 rescues NADH lifetime and distribution in the cell nucleus from Sirt1−/− MEFs. (A) Confocal images from Sirt1−/− MEFs stably expressing EGFP-fused SIRT1 protein or the catalytically inactive mutant form SIRT1(H355A). Western blot was performed on total extracts from the indicated cell lines and blotted with a specific antibody against SIRT1. Anti-p84 was used as a loading control. (B) Intensity and FLIM (lifetime) representative images from Sirt1−/−/SIRT1-EGFP MEFs either untreated or treated with the SIRT1-specific inhibitor EX527 (50 μM) during 20 h. Individual fractions of free NADH distribution for 10–15 single cells are shown in histograms in Lower and overlapped with those from WT and Sirt1−/− MEFs (from Fig. 1) as indicated with the color code. The histogram in Right shows comparative analyses in the percentage change on the fraction of free NADH. Data were normalized for nontreated WT MEFs = 0. Means ± SEM of three independent experiments are presented. ns, Not significant by two-tailed MWU. *P < 0.05 by two-tailed MWU; **P < 0.01 by two-tailed MWU; ***P < 0.001 by two-tailed MWU. Bf, bright field.
Fig. S6.
Generation of functional stable cell lines Sirt1−/−/SIRT1-EGFP and Sirt1−/−/SIRT1(H355A)-EGFP. (A) Confocal images showing the location of the stable transfected nuclear SIRT1-EGFP and the catalytically inactive SIRT1(H355A)-EGFP together with the transiently transfected nucleolar marker mOrange2-Fibrillarin fusion protein. (B) Western blot from total protein extracts from 1, WT MEFs; 2, Sirt1−/− MEFs; 3, Sirt1−/−/SIRT1-EGFP MEFs; and 4, Sirt1−/−/SIRT1(H355A)-EGFP. Extracts were blotted against the indicated antibodies. (C) RT-PCR analyses from total RNA harvested at the indicated time points after synchronization using dexamethasone (DEX) shock. The amount of Dbp and Per2 mRNA was determined by real time PCR. Means ± SEM of three independent experiments are presented.
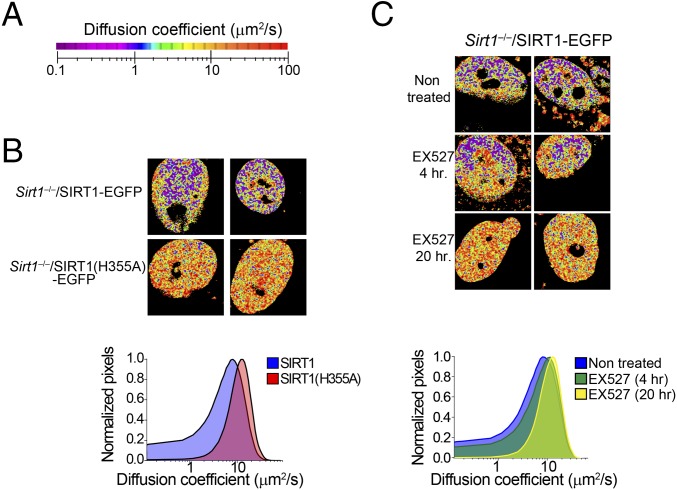
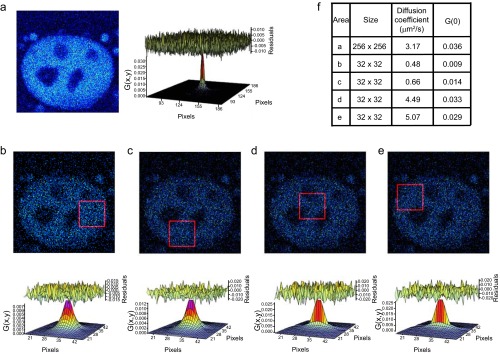
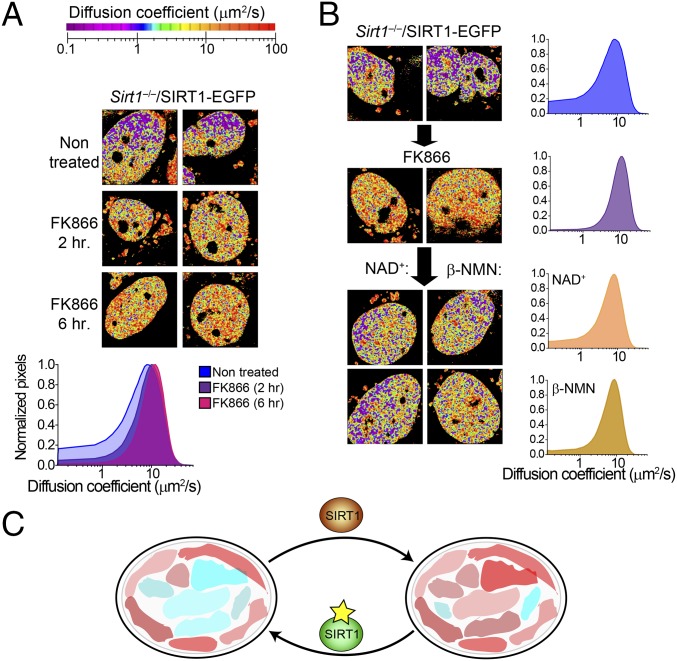
To study nuclear dynamics of SIRT1 under different metabolic states, we used fluorescence fluctuation spectroscopy, a noninvasive fluorescence microscopy technique having single-molecule sensitivity (51) (SI Introduction to the Techniques). Correlation analyses of fluorescence fluctuations allow the determination of dynamic properties, such as diffusion coefficients of molecules. To directly identify the components of SIRT1 dynamics and thereby obtain information on the mobility of the protein, we applied short-time sequence fluorescence correlation spectroscopy (phasor fluorescence correlation spectroscopy) (Materials and Methods) (32). Different from single-point fluorescence correlation spectroscopy, this analysis generates a diffusion map of the protein in living cells with pixel resolution. The phasor fluorescence correlation spectroscopy analysis of Sirt1−/−/SIRT1-EGFP cells revealed that the mobility of SIRT1 is heterogeneous across the nucleus (Fig. 5 A and B). Two general populations of nuclear SIRT1 were found, which display some significant differences. (i) A clustered population of SIRT1 proteins shows slow-diffusion coefficient between <0.1 and 1 μm2/s; these slow diffusing populations are color-coded in the fluorescence correlation spectroscopy images as purple-blue speckles. (ii) An interspersed population of fast-diffusing SIRT1 species has mobility between 5 and 50 μm2/s; these fast diffusing populations are colored as yellow-red areas (Fig. 5 A and B). The presence of these two different populations was further confirmed using raster scan image correlation spectroscopy (RICS) (29, 33) in several subnuclear territories (Fig. S7). Interestingly, a parallel short-time sequence fluorescence correlation spectroscopy analysis from Sirt1−/−/SIRT1(H355A)-EGFP MEFs reveals that the slow-diffusing population of SIRT1 molecules is significantly reduced, because almost all SIRT1(H355A) pertain to a fast-diffusing population (Fig. 5C). These data suggest that the slow-diffusing population of SIRT1 correlates with enzymatically active SIRT1 molecules. We further confirmed these data by using the SIRT1 inhibitor EX527 on Sirt1−/−/SIRT1-EGFP cells (Fig. 5C). Although a short-term 4-h treatment with EX527 led to a decrease of slow-diffusing SIRT1, a 20-h treatment completely depleted the population of slow-diffusing SIRT1 molecules (Fig. 5C). Therefore, SIRT1 diffusion coefficient seems to be a biophysical signature of its activity.
Fig. 5.
SIRT1 dynamics in the cell nucleus depends on its enzymatic activity. (A) Color scale used to represent the calculated diffusion coefficient of EGFP-fused proteins using the phasor-based fluorescence correlation spectroscopy (phasor fluorescence correlation spectroscopy) technique. (B) Colored images depicting the diffusion rate of SIRT1-EGFP and the catalytically inactive SIRT1(H355A)-EGFP calculated using phasor fluorescence correlation spectroscopy. Two representative images are shown. The histogram in Lower shows the comparison between the diffusion coefficients of two proteins. Mean values are represented from n = 10–15 cells per experiment. Experiments were done in triplicate. (C) Phasor fluorescence correlation spectroscopy-colored images from Sirt1−/−/SIRT1-EGFP MEFs either untreated or treated with the specific SIRT1 inhibitor EX527 (50 μM) during 4 or 20 h. Two representative images are shown. The histogram in Lower represents a comparative analysis between three conditions. Means from n = 10–15 cells are presented. Triplicate experiments were performed.
Fig. S7.
SIRT1-EFGFP diffusion coefficient in the cell nucleus is variable. (A–E) Intensity image and the calculated 2D correlation function from RICS at different areas of the nucleus measuring (A) 256 × 256 pixels or (B–E) 32 × 32 pixels (indicated as red squares). The top of the correlation function shows the randomness of the residuals when fitted with a one-component diffusion model. (F) Table showing the calculated value for the diffusion coefficient at selected areas of the cell.
Control of SIRT1 Dynamics and Subnuclear Distribution by NAD+ Metabolism.
To test the hypothesis that SIRT1 subnuclear distribution is intimately linked to nuclear metabolism, we treated Sirt1−/−/SIRT1-EGFP with FK866 (Fig. 6A). Remarkably, a 2-h treatment with FK866 leads to a significant reduction in the slow-diffusing population of SIRT1 molecules, and a 6-h treatment further reinforces this effect (Fig. 6A). To establish whether this effect is directly mediated by NAD+ dampening after FK866 treatment, we supplemented treated Sirt1−/−/SIRT1-EGFP cells with NAD+, therefore restoring its levels. As shown in Fig. 5B, NAD+ supplementation restores the population of slow-diffusing SIRT1 molecules. Indeed, treatment with the NAD+ precursor β-NMN (Fig. 3A) had a similar effect, limiting SIRT1 diffusion in specific subnuclear territories (Fig. 6B), which might correspond to niches of SIRT1 activity.
Fig. 6.
NAD+ metabolism and salvage pathway impact mobility of SIRT1. (A) Phasor fluorescence correlation spectroscopy-colored images from Sirt1−/−/SIRT1-EGFP MEFs either untreated or treated with the specific NAMPT inhibitor FK866 (10 nM) during 2 or 6 h. The histogram in Lower shows a comparative analysis on the diffusion coefficient from three conditions. Means from n = 10–15 cells are presented. Experiments were performed in triplicate. (B) Phasor fluorescence correlation spectroscopy images from untreated Sirt1−/−/SIRT1-EGFP MEFs, which were then treated with FK866 (10 nM) during 6 h. Then, either (Left) NAD+ (2 mM) or (Center) β-NMN (5 mM) was added. Two representative cells are shown for each condition. Histograms in Right represent means from 10 to 15 cells. Triplicate experiments were done. (C) Model illustrating nuclear territories for metabolic states. Bound NADH is represented as red colors, whereas free NADH is shown as blue colors (in the text).
Discussion
A central, yet unresolved issue in nuclear cell biology is whether metabolites could be distributed in discrete territories that would then facilitate the function of regulatory enzymes in a time- and space-specific manner. Here, we describe an intimate link between nuclear metabolism and SIRT1 function. Our results favor a scenario where the deacetylase SIRT1 contributes to the distribution of free and protein-bound NADH to distinct nuclear metabolic niches (Fig. 6C). The enzymatic activity of SIRT1 is coupled to the availability of the coenzyme NAD+. The NAD+/NADH ratio defines the cellular redox state, and variations in this ratio are thought to alter SIRT1 activity (52, 53). The NADH pool is small, and metabolic events that modify the NAD+/NADH relation cause a much greater change in the levels of NADH than NAD+ (21, 22). Indeed, variations in intranuclear redox states are likely to have a much more direct impact on SIRT1 activity than the total cellular redox ratio. Because mitochondria harbor a large part of oxidoreduction reactions, greater changes in the mitochondrial redox ratio are expected to happen under metabolic stress. Whether these variations are accompanied by intranuclear redox changes and/or NADH sequestering remains to be established. Hence, there is a need for understanding intranuclear metabolism, because it will have a direct impact in the regulation of nuclear NADH-responsive proteins.
SIRT1 is known to contribute to the regulation of cellular homeostasis (3, 20). Here, we have uncovered a yet unexplored relationship between nuclear NADs and SIRT1 function and dynamics. Our results show that SIRT1 controls a significant fraction of nuclear NADH metabolism (Fig. 1). Whether this effect is direct, caused strictly by the consumption of NAD+ on SIRT1 activation, or indirect through SIRT1-mediated downstream signaling remains to be determined. However, the metabolic transitions described here occur already within 2 h on activation of SIRT1 by SRT2183 (Fig. 2).
Our findings show that SIRT1 has an overall homogenous distribution inside of the nucleus; however, it presents niches of activity (Figs. 5 and 6 A and B). Indeed, a population of SIRT1 molecules diffuses slower than 1 μm2/s and tends to disappear on SIRT1 catalytic inactivation by NAD+ depletion (Figs. 5 and 6 A and B). Because the diffusion coefficient of free nuclear EGFP is >10 μm2/s (our measurements) (50, 51), the slow mobility displayed by SIRT1-EGFP at specific locations is presumably linked to its interaction with substrates or to the coenzyme NAD+. Because SIRT1 Km for its substrates is lowered on activation (46, 49, 50), it seems reasonable to conclude that active SIRT1 molecules are organized in niches of activity. These presumed niches could be possibly linked to intranuclear metabolic territories with higher levels of free NAD+ (Fig. 5C).
Because free NADH is available for utilization by enzymes, only this free pool in the nucleus is relevant in controlling transcription by NADH-dependent enzymes and transcription factors. In addition to SIRT1, other redox-sensing nuclear proteins are likely to be affected by intranuclear organization of NADH metabolism. Among these proteins, BMAL1 and NPAS2/CLOCK are β-HLH-PAS domain-containing transcription factors, which heterodimerize and drive the expression of circadian genes (54). This notion is relevant, because SIRT1 modulates circadian gene expression (6, 9, 19). Hence, intranuclear territories presenting different redox ratios could serve as a regulatory layer for circadian transcription through SIRT1 or restrict circadian transcription to subnuclear domains (41, 55). An interesting case is the transcription factor CtBP that can sense free NADH, resulting in controlling its binding affinity to specific interacting proteins (40). An analogous case relates to the transcriptional regulator Oct-1, which binds nuclear p38/GAPDH in an NADH-dependent manner (56). Thus, compartmentalization of certain programs of gene expression in the cell nucleus could be assisted by intranuclear metabolic microenvironments.
Materials and Methods
Cell Culture, Transfections, and Treatments.
A complete description is in SI Materials and Methods.
Fluorescence Lifetime Imaging and Diffusion Measurements.
FLIM data were collected using a Zeiss Axiovert S1000TV Microscope with two-photon excitation at 740 nm. The emission from free and bound NADH was obtained using a 460/80-nm band pass filter to reduce the effect of FAD fluorescence and collected using a Becker Hickel TCSPC 830 Card. The decay histogram at each pixel was analyzed using the phasor approach to FLIM (SimFCS software; Laboratory for Fluorescence Dynamics), and represented in the phasor plot (Fig. S8). Excitation of EGFP-tagged proteins for diffusion measurements (RICS and phasor fluorescence correlation spectroscopy) was done with a 488-nm Argon laser using an Olympus Plan/Apo, 1.2-N.A. objective. A detailed description is in SI Materials and Methods.
Fig. S8.
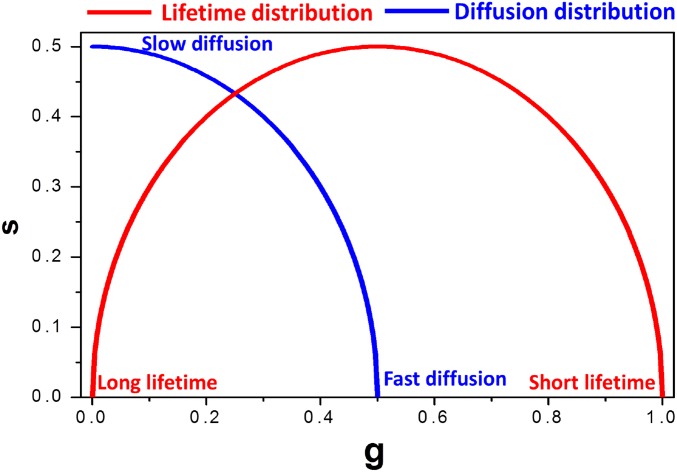
Phasor plot diagram. Phasor plot showing the universal circle used for FLIM analyses (red) and phasor fluorescence correlation spectroscopy diffusion calculations (blue). The short and the long lifetimes appear at small and large phase angles along and inside the red circle, respectively. The faster and the slowed diffusing molecules appear at the smaller and larger phase angles, respectively, along the blue semicircle.
SI Materials and Methods
Cell Culture.
MEFs from SIRT1-KO mice were obtained as described previously (6, 9) and cultured in DMEM supplemented with 5% (vol/vol) FBS, 5% (vol/vol) newborn calf serum (Gibco), and antibiotics. Stable transfected cell lines were maintained in the presence of 750 μg/mL G418 (InvivoGen). The human diploid fibroblast cell line was a gift from Heiko Hermeking, Ludwig Maximilian University of Munich, Munich (61). All cell lines tested negative for mycoplasma contamination. For live imaging, cells were plated in 35-mm glass-bottom microwell dishes (MatTek·P35G-1.5–14-C) and allowed to grow to 50–70% confluence.
Stable Transfections.
Cell lines, which stably express SIRT1 protein tagged with the EGFP, were generated from Sirt1−/− MEFs (7); 40 μg plasmid expressing SIRT1-EGFP (pEGPF-N3-SIRT1) or the empty vector (pEGFP-N3) was linearized with the XbaI restriction enzyme (New England Biolabs) before transfection. A 10-cm dish with Sirt1−/− MEFs at 70% confluence was transfected with each plasmid using Lipofectamine 2000 (Life Technologies) according to the manufacturer’s protocol. At 15 h posttransfection, media were replaced with new media. At 24 h after transfection, cells were distributed in 10 dishes (10 cm), and at 48 h posttransfection, a final concentration of 1 mg/mL G418 (InvivoGen) was added to each dish to allow selection of tranformants. Media were periodically replaced by adding new G418; 20–25 d posttransfection, G418-resistant clones were individually isolated into new dishes using cloning cylinders. The same strategy was followed using a plasmid encoding a mutant version of SIRT1 pEGFP-N3-SIRT1(H355A), which was obtained at GenScript from pEGPF-N3-SIRT1 plasmid. We used BioT Transfection Reagent (Bioland Sci.) for transient transfections of mOrange2-Fibrillarin by following the manufacturer’s protocol. All of the vectors were examined and verified by restriction analysis and sequencing. mOrange2-Fibrillarin-7 plasmid was purchased from Addgene and has been described in ref. 62.
Antibodies and Reagents.
The antibodies used in this study are as follows: anti-SIRT1, Millipore catalog number 07–131; anti-MLL1 C terminus, Bethyl catalog number A300-374A; anti-p84, GeneTex catalog number GTX70220; antiacetyl p53 (Lys-379), Cell Signaling catalog number 2570; antiacetyl MLL1 (Lys1130-1133) was previously described (6). All purchased antibodies were validated for mammalian studies (as shown on the manufacturers’ websites): EX527, Tocris Bioscience; FK866, Axon Medchem; and NAD+ (N8535), NAM (N0636), and β-NMN (N3501), Sigma-Aldrich. SRT2183 was provided by Christine Loh, Sirtris Pharmaceuticals, Cambridge, MA.
Fluorescence Lifetime Imaging.
The autofluorescence lifetime images of the nuclei were measured using a modified Zeiss Axiovert S100TV Microscope (Carl Zeiss Microscopy GmbH) equipped with a Spectra-Physics MaiTai HP Laser (Spectra-Physics) and a Becker & Hickl SPC-830 (Becker & Hickl GmbH) Acquisition Card. The samples were excited with the 740-nm laser line using a 40× water immersion objective (1.2 N.A.; Zeiss) using two-photon excitation. The fluorescence was passed through a filter (460/80 nm), collected using a photomultiplier tube (H7422P-40; Hamamatsu), and recorded using the SPC-830 card. The pixel dwell time for the acquisitions was 32 µs, and the images were taken at 256 × 256 pixels. To obtain high signal to noise ratio, 30–50 frames were collected. The data from the each pixel were recorded and analyzed using the SimFCS computer software (Laboratory for Fluorescence Dynamics, University of California, Irvine). The intensity decays collected at each pixel of the image were transformed to the Fourier space, and the phasor coordinates were calculated using the following relations:
and
where gi,j(ω) and si,j(ω) are the x and y coordinates of the phasor plot, respectively, and n and ω are the harmonic number and the angular frequency of the laser pulsed excitation, respectively. The transformed data were then plotted in the phasor plot in a way that the data from each individual pixel are transformed to a point in the phasor plot (25, 35, 36). The distribution of the phasor points was selected using a continuous color scheme, and the intensity image was painted accordingly using the same color scheme as depicted in Fig. 1B. This continuous scheme reveals segregated areas of different lifetimes. In the phasor transformation of the lifetime, the fluorescence intensity decays that originate from a single exponential appear on the universal semicircle (Fig. 1B). Free NADH and bound NADH have lifetimes of 0.4 and ∼3.4 ns, respectively, and their individual fluorescence intensity decay appears close to the universal circle (63). In Fig. 1B, the phasor positions of free and bound NADH are represented by the blue and the red cursors, respectively. The line joining the two cursors is named the metabolic trajectory. The phasor points originating from each pixel of the image for the acquisition described above are on the metabolic trajectory. The distribution of the points along the metabolic trajectory can be then transformed to a distribution depicting the number of pixels belonging to a certain fraction of free NADH using the law of linear addition in phasor space (35). According to this particular phasor property, the relative contributions of two or more different phasor points to another point in between them are inversely proportional to the distances between the point in the line and the points and the two extreme points defining the line (35). Thus, the fraction of free NADH in a phasor plot of a point along the metabolic trajectory is inversely proportional to the distance of that phasor point to the individual position of free NADH or the bound form of NADH phasor, respectively. Thus, based on these distances, each distribution along the metabolic trajectory was converted to a histogram of normalized number of pixels against the fraction of free NADH for each sample. To compare the population of each sample and evaluate differences between samples, histograms of the number of pixels with a given ratio of free/bound NADH from every measurement were presented. The distribution of phasor points originating from FLIM measurements appears on (for the monoexponential decays) or inside (for multiexponential decays) the universal semicircle (red in Fig. S8). The larger phase angle in the phasor plot is indicative of the longer lifetime.
Diffusion Measurements.
The diffusion of EGFP-tagged proteins in the nucleus was measured using two fluorescence fluctuation techniques—RICS (33) and the phasor approach to diffusion (phasor fluorescence correlation spectroscopy) (32). Both types of measurements were performed using a modified Olympus Fluoview FV1000 Microscope (Olympus) with a specialized scanning unit, which can be independently driven using an externally programmable IOtech card (Measurement Computing Corporation). The samples were excited with a 488-nm line of the Argon laser using one-photon excitation and a 63× water immersion objective (Olympus Plan-Apo; 1.2 N.A.). The fluorescence was collected using the same objective, passed through a pinhole to disregard out of focus fluorescence and a filter to collect the EGFP fluorescence (505–605 nm), and focused on the internal photomultiplier The signal from the photomultiplier was transformed in photon counts using an amplifier (ISS) and a discriminator (Model 6915; Phillips Scientific) and recorded using the IOtech card. The data acquisition and the subsequent analysis of the RICS and phasor fluorescence correlation spectroscopy were carried out using the SimFCS software (Laboratory for Fluorescence Dynamics, University of California, Irvine). Both types of data were collected in the format 256 × 256 pixels. The pixel size, the dwell time, and the number of frames for RICS acquisition were fixed at 37 nm, 20 µs, and 100 frames, respectively. The pixel dwell time for the phasor fluorescence correlation spectroscopy measurements was 64 µs, and the repeat number was 256 for the point scan mode acquisition. In this acquisition, the laser stayed at a point for 64 × 256 µs, and the fluctuations of the fluorescence intensity data were collected. After data at one pixel were collected, the laser was moved to the adjacent pixel, and the measurement was repeated. Because phasor fluorescence correlation spectroscopy is a temporal correlation technique, the pixel size is not limited; hence, it varied among experiments to fit the size of the whole nucleus.
The spatiotemporal correlation functions for RICS were calculated for an area of 32 × 32 pixels in different sections of the nucleus. The RICS correlation function can be fitted for one or multiple components, and the diffusion coefficients can be recovered provided that the point spread function (PSF) is known (33). Hence, the PSF for these measurements was calculated from the single-point fluorescence correlation spectroscopy of EGFP in buffer (using D = 90 µm2/s). The RICS correlation functions at different areas of the nucleus, and the residuals for a single diffusion component fitting were calculated (Fig. S7). The randomness of the residuals of these single-component fits showed that one component was enough for the fits. RICS, being a spatiotemporal correlation technique, is limited to cover a certain number of pixels and cannot achieve pixel resolution.
To analyze with pixel resolution in the fluctuation measurements across the whole-cell nucleus, phasor fluorescence correlation spectroscopy (32) was used. In this method of correlation functions, G(τ) is calculated for the very short fluorescence intensity acquisitions at each pixel of the image using the formula
where τ is the lag time, and I(t) and I(t + τ) are the intensities at time t and time t + τ, respectively.
Because these acquisitions are very short (∼2–10 ms), the calculated correlation functions cannot be described by the traditional single-point fluorescence correlation spectroscopy equations. The details of phasor fluorescence correlation spectroscopy and the analysis have been described elsewhere (32). Briefly, the correlation functions at each pixel are transformed to the phasor plot using analogous calculations for the phasor coordinates g and s as described for FLIM analyses:
and
For normalization of the correlation decays in the Fourier space, the relation (s2 + g2)1/2 = 0.5 was applied. Hence, the phasor fluorescence correlation spectroscopy decays appear along the blue line shown in the phasor plot from Fig. S8. The smaller phase angle in this distribution is indicative of the fast correlation time, and the larger phase angle is indicative of the slow correlation time. Correlation times were converted to the diffusion coefficients, and a histogram of diffusion coefficients was calculated. The transformation was achieved using a 3D Gaussian volume with 0.24-µm waist and a 3D diffusion model. The distribution of the points for the phasor fluorescence correlation spectroscopy can be selected using a continuous colored scheme, and the image can be colored accordingly, generating a detailed map of the diffusion in the image with a pixel resolution as previously described (32).
Live Imaging of Fluorescent Proteins.
EGFP- and mOrange-tagged molecules were visualized in live cells using a Leica TSC SP5 Confocal Microscope (Leica Microsystems Inc.) with a 60× 1.4 immersion oil objective lens controlled by a Leica LAS System. Images were processed for overlay in different channels using ImageJ software. Before imaging, cells were incubated with 1:1,000 dilution of DRAQ5 (BioStatus) during 20 min at 37 °C.
Statistical Analyses and Images.
Comparisons between samples were performed using the nonparametric, two-tailed MWU. Statistics were performed with GraphPad Prism 6.0 software (GraphPad Software, Inc.). Histograms and graphs were generated using OriginPro 8.5.0 SR1 (OriginLab). Figures were prepared using Adobe Illustrator 15.1 (Adobe Systems Incorporated). The analyses of the phasor fluorescence correlation spectroscopy and FLIM were performed using the SimFCS software (Laboratory for Fluorescence Dynamics).
Acknowledgments
We thank all of the members from the laboratory of E.G. and the laboratory of P.S.-C. for helpful discussion and advice. We also thank Dr. Yoshiyuki Horio (Sapporo Medical University) for providing pEGFPN2-SIRT1 plasmid, Dr. Heiko Hermeking (Ludwig Maximilian University of Munich) for providing human diploid fibroblasts, and Dr. Raul Mostoslavsky (Harvard Medical School) for providing Sirt6−/− MEFs. The Laboratory for Fluorescence Dynamics is supported by NIH Grant P41 GM103540, and E.G. is supported by NIH Grant P50 GM076516. Research at the Center for Epigenetics and Metabolism is supported by NIH Grants DA036408 (to P.-S.C.) and AG041504 (to P.-S.C.), the Novo Foundation Challenge Grant (to P.-S.C.), and INSERM (to P.-S.C.).
Footnotes
The authors declare no conflict of interest.
This article is a PNAS Direct Submission.
This article contains supporting information online at www.pnas.org/lookup/suppl/doi:10.1073/pnas.1609227113/-/DCSupplemental.
References
- 1.Houtkooper RH, Pirinen E, Auwerx J. Sirtuins as regulators of metabolism and healthspan. Nat Rev Mol Cell Biol. 2012;13(4):225–238. doi: 10.1038/nrm3293. [DOI] [PMC free article] [PubMed] [Google Scholar]
- 2.Michan S, Sinclair D. Sirtuins in mammals: Insights into their biological function. Biochem J. 2007;404(1):1–13. doi: 10.1042/BJ20070140. [DOI] [PMC free article] [PubMed] [Google Scholar]
- 3.Haigis MC, Sinclair DA. Mammalian sirtuins: Biological insights and disease relevance. Annu Rev Pathol. 2010;5:253–295. doi: 10.1146/annurev.pathol.4.110807.092250. [DOI] [PMC free article] [PubMed] [Google Scholar]
- 4.Herranz D, et al. Sirt1 improves healthy ageing and protects from metabolic syndrome-associated cancer. Nat Commun. 2010;1:3. doi: 10.1038/ncomms1001. [DOI] [PMC free article] [PubMed] [Google Scholar]
- 5.Kaeberlein M, McVey M, Guarente L. The SIR2/3/4 complex and SIR2 alone promote longevity in Saccharomyces cerevisiae by two different mechanisms. Genes Dev. 1999;13(19):2570–2580. doi: 10.1101/gad.13.19.2570. [DOI] [PMC free article] [PubMed] [Google Scholar]
- 6.Aguilar-Arnal L, Katada S, Orozco-Solis R, Sassone-Corsi P. NAD(+)-SIRT1 control of H3K4 trimethylation through circadian deacetylation of MLL1. Nat Struct Mol Biol. 2015;22(4):312–318. doi: 10.1038/nsmb.2990. [DOI] [PMC free article] [PubMed] [Google Scholar]
- 7.Cantó C, et al. AMPK regulates energy expenditure by modulating NAD+ metabolism and SIRT1 activity. Nature. 2009;458(7241):1056–1060. doi: 10.1038/nature07813. [DOI] [PMC free article] [PubMed] [Google Scholar]
- 8.Gomes AP, et al. Declining NAD(+) induces a pseudohypoxic state disrupting nuclear-mitochondrial communication during aging. Cell. 2013;155(7):1624–1638. doi: 10.1016/j.cell.2013.11.037. [DOI] [PMC free article] [PubMed] [Google Scholar]
- 9.Nakahata Y, et al. The NAD+-dependent deacetylase SIRT1 modulates CLOCK-mediated chromatin remodeling and circadian control. Cell. 2008;134(2):329–340. doi: 10.1016/j.cell.2008.07.002. [DOI] [PMC free article] [PubMed] [Google Scholar]
- 10.Masri S, Sassone-Corsi P. Sirtuins and the circadian clock: Bridging chromatin and metabolism. Sci Signal. 2014;7(342):re6. doi: 10.1126/scisignal.2005685. [DOI] [PubMed] [Google Scholar]
- 11.Nakahata Y, Sahar S, Astarita G, Kaluzova M, Sassone-Corsi P. Circadian control of the NAD+ salvage pathway by CLOCK-SIRT1. Science. 2009;324(5927):654–657. doi: 10.1126/science.1170803. [DOI] [PMC free article] [PubMed] [Google Scholar]
- 12.Ramsey KM, et al. Circadian clock feedback cycle through NAMPT-mediated NAD+ biosynthesis. Science. 2009;324(5927):651–654. doi: 10.1126/science.1171641. [DOI] [PMC free article] [PubMed] [Google Scholar]
- 13.Sahar S, et al. Circadian control of fatty acid elongation by SIRT1 protein-mediated deacetylation of acetyl-coenzyme A synthetase 1. J Biol Chem. 2014;289(9):6091–6097. doi: 10.1074/jbc.M113.537191. [DOI] [PMC free article] [PubMed] [Google Scholar]
- 14.Masri S, et al. Partitioning circadian transcription by SIRT6 leads to segregated control of cellular metabolism. Cell. 2014;158(3):659–672. doi: 10.1016/j.cell.2014.06.050. [DOI] [PMC free article] [PubMed] [Google Scholar]
- 15.Mostoslavsky R, et al. Genomic instability and aging-like phenotype in the absence of mammalian SIRT6. Cell. 2006;124(2):315–329. doi: 10.1016/j.cell.2005.11.044. [DOI] [PubMed] [Google Scholar]
- 16.Ford E, et al. Mammalian Sir2 homolog SIRT7 is an activator of RNA polymerase I transcription. Genes Dev. 2006;20(9):1075–1080. doi: 10.1101/gad.1399706. [DOI] [PMC free article] [PubMed] [Google Scholar]
- 17.Mohrin M, et al. Stem cell aging. A mitochondrial UPR-mediated metabolic checkpoint regulates hematopoietic stem cell aging. Science. 2015;347(6228):1374–1377. doi: 10.1126/science.aaa2361. [DOI] [PMC free article] [PubMed] [Google Scholar]
- 18.Shin J, et al. SIRT7 represses Myc activity to suppress ER stress and prevent fatty liver disease. Cell Reports. 2013;5(3):654–665. doi: 10.1016/j.celrep.2013.10.007. [DOI] [PMC free article] [PubMed] [Google Scholar]
- 19.Bellet MM, et al. Pharmacological modulation of circadian rhythms by synthetic activators of the deacetylase SIRT1. Proc Natl Acad Sci USA. 2013;110(9):3333–3338. doi: 10.1073/pnas.1214266110. [DOI] [PMC free article] [PubMed] [Google Scholar]
- 20.Imai S, Guarente L. NAD+ and sirtuins in aging and disease. Trends Cell Biol. 2014;24(8):464–471. doi: 10.1016/j.tcb.2014.04.002. [DOI] [PMC free article] [PubMed] [Google Scholar]
- 21.Lakowicz JR, Szmacinski H, Nowaczyk K, Johnson ML. Fluorescence lifetime imaging of free and protein-bound NADH. Proc Natl Acad Sci USA. 1992;89(4):1271–1275. doi: 10.1073/pnas.89.4.1271. [DOI] [PMC free article] [PubMed] [Google Scholar]
- 22.Bird DK, et al. Metabolic mapping of MCF10A human breast cells via multiphoton fluorescence lifetime imaging of the coenzyme NADH. Cancer Res. 2005;65(19):8766–8773. doi: 10.1158/0008-5472.CAN-04-3922. [DOI] [PubMed] [Google Scholar]
- 23.Chorvat D, Chorvatova A. Multi-wavelength fluorescence lifetime spectroscopy: A new approach to the study of endogenous fluorescence in living cells and tissues. Laser Phys Lett. 2009;6(3):175–193. [Google Scholar]
- 24.Stringari C, et al. Phasor approach to fluorescence lifetime microscopy distinguishes different metabolic states of germ cells in a live tissue. Proc Natl Acad Sci USA. 2011;108(33):13582–13587. doi: 10.1073/pnas.1108161108. [DOI] [PMC free article] [PubMed] [Google Scholar]
- 25.Stringari C, Nourse JL, Flanagan LA, Gratton E. Phasor fluorescence lifetime microscopy of free and protein-bound NADH reveals neural stem cell differentiation potential. PLoS One. 2012;7(11):e48014. doi: 10.1371/journal.pone.0048014. [DOI] [PMC free article] [PubMed] [Google Scholar]
- 26.Stringari C, et al. In vivo single-cell detection of metabolic oscillations in stem cells. Cell Reports. 2015;10(1):1–7. doi: 10.1016/j.celrep.2014.12.007. [DOI] [PMC free article] [PubMed] [Google Scholar]
- 27.Walsh AJ, et al. Optical metabolic imaging identifies glycolytic levels, subtypes, and early-treatment response in breast cancer. Cancer Res. 2013;73(20):6164–6174. doi: 10.1158/0008-5472.CAN-13-0527. [DOI] [PMC free article] [PubMed] [Google Scholar]
- 28.Yaseen MA, et al. In vivo imaging of cerebral energy metabolism with two-photon fluorescence lifetime microscopy of NADH. Biomed Opt Express. 2013;4(2):307–321. doi: 10.1364/BOE.4.000307. [DOI] [PMC free article] [PubMed] [Google Scholar]
- 29.Digman MA, Stakic M, Gratton E. Raster image correlation spectroscopy and number and brightness analysis. Methods Enzymol. 2013;518:121–144. doi: 10.1016/B978-0-12-388422-0.00006-6. [DOI] [PubMed] [Google Scholar]
- 30.Magde D, Elson EL, Webb WW. Fluorescence correlation spectroscopy. II. An experimental realization. Biopolymers. 1974;13(1):29–61. doi: 10.1002/bip.1974.360130103. [DOI] [PubMed] [Google Scholar]
- 31.Magde D, Webb WW, Elson EL. Fluorescence correlation spectroscopy. III. Uniform translation and laminar flow. Biopolymers. 1978;17(2):361–376. [Google Scholar]
- 32.Ranjit S, Lanzano L, Gratton E. Mapping diffusion in a living cell via the phasor approach. Biophys J. 2014;107(12):2775–2785. doi: 10.1016/j.bpj.2014.08.041. [DOI] [PMC free article] [PubMed] [Google Scholar]
- 33.Rossow MJ, Sasaki JM, Digman MA, Gratton E. Raster image correlation spectroscopy in live cells. Nat Protoc. 2010;5(11):1761–1774. doi: 10.1038/nprot.2010.122. [DOI] [PMC free article] [PubMed] [Google Scholar]
- 34.Digman MA, Caiolfa VR, Zamai M, Gratton E. The phasor approach to fluorescence lifetime imaging analysis. Biophys J. 2008;94(2):L14–L16. doi: 10.1529/biophysj.107.120154. [DOI] [PMC free article] [PubMed] [Google Scholar]
- 35.Digman MA, Gratton E. The phasor approach to fluorescence lifetime imaging: Exploiting phasor linear properties. In: Marcu L, French PMW, Elson DS, editors. Fluorescence Lifetime Spectroscopy and Imaging: Principles and Applications in Biomedical Diagnostics. CRC; Boca Raton, FL: 2014. pp. 235–248. [Google Scholar]
- 36.Redford GI, Clegg RM. Polar plot representation for frequency-domain analysis of fluorescence lifetimes. J Fluoresc. 2005;15(5):805–815. doi: 10.1007/s10895-005-2990-8. [DOI] [PubMed] [Google Scholar]
- 37.Pate KT, et al. Wnt signaling directs a metabolic program of glycolysis and angiogenesis in colon cancer. EMBO J. 2014;33(13):1454–1473. doi: 10.15252/embj.201488598. [DOI] [PMC free article] [PubMed] [Google Scholar]
- 38.Stringari C, et al. Metabolic trajectory of cellular differentiation in small intestine by Phasor Fluorescence Lifetime Microscopy of NADH. Sci Rep. 2012;2:568. doi: 10.1038/srep00568. [DOI] [PMC free article] [PubMed] [Google Scholar]
- 39.Wright BK, et al. Phasor-FLIM analysis of NADH distribution and localization in the nucleus of live progenitor myoblast cells. Microsc Res Tech. 2012;75(12):1717–1722. doi: 10.1002/jemt.22121. [DOI] [PMC free article] [PubMed] [Google Scholar]
- 40.Zhang Q, Piston DW, Goodman RH. Regulation of corepressor function by nuclear NADH. Science. 2002;295(5561):1895–1897. doi: 10.1126/science.1069300. [DOI] [PubMed] [Google Scholar]
- 41.Aguilar-Arnal L, Sassone-Corsi P. Chromatin landscape and circadian dynamics: Spatial and temporal organization of clock transcription. Proc Natl Acad Sci USA. 2015;112(22):6863–6870. doi: 10.1073/pnas.1411264111. [DOI] [PMC free article] [PubMed] [Google Scholar]
- 42.Katada S, Imhof A, Sassone-Corsi P. Connecting threads: Epigenetics and metabolism. Cell. 2012;148(1-2):24–28. doi: 10.1016/j.cell.2012.01.001. [DOI] [PubMed] [Google Scholar]
- 43.Feldman JL, et al. Kinetic and structural basis for acyl-group selectivity and NAD(+) dependence in sirtuin-catalyzed deacylation. Biochemistry. 2015;54(19):3037–3050. doi: 10.1021/acs.biochem.5b00150. [DOI] [PMC free article] [PubMed] [Google Scholar]
- 44.Napper AD, et al. Discovery of indoles as potent and selective inhibitors of the deacetylase SIRT1. J Med Chem. 2005;48(25):8045–8054. doi: 10.1021/jm050522v. [DOI] [PubMed] [Google Scholar]
- 45.Dai H, et al. SIRT1 activation by small molecules: Kinetic and biophysical evidence for direct interaction of enzyme and activator. J Biol Chem. 2010;285(43):32695–32703. doi: 10.1074/jbc.M110.133892. [DOI] [PMC free article] [PubMed] [Google Scholar]
- 46.Hubbard BP, et al. Evidence for a common mechanism of SIRT1 regulation by allosteric activators. Science. 2013;339(6124):1216–1219. doi: 10.1126/science.1231097. [DOI] [PMC free article] [PubMed] [Google Scholar]
- 47.Revollo JR, Grimm AA, Imai S. The NAD biosynthesis pathway mediated by nicotinamide phosphoribosyltransferase regulates Sir2 activity in mammalian cells. J Biol Chem. 2004;279(49):50754–50763. doi: 10.1074/jbc.M408388200. [DOI] [PubMed] [Google Scholar]
- 48.Hasmann M, Schemainda I. FK866, a highly specific noncompetitive inhibitor of nicotinamide phosphoribosyltransferase, represents a novel mechanism for induction of tumor cell apoptosis. Cancer Res. 2003;63(21):7436–7442. [PubMed] [Google Scholar]
- 49.Armour SM, et al. A high-confidence interaction map identifies SIRT1 as a mediator of acetylation of USP22 and the SAGA coactivator complex. Mol Cell Biol. 2013;33(8):1487–1502. doi: 10.1128/MCB.00971-12. [DOI] [PMC free article] [PubMed] [Google Scholar]
- 50.Milne JC, et al. Small molecule activators of SIRT1 as therapeutics for the treatment of type 2 diabetes. Nature. 2007;450(7170):712–716. doi: 10.1038/nature06261. [DOI] [PMC free article] [PubMed] [Google Scholar]
- 51.Bulseco DA, Wolf DE. Fluorescence correlation spectroscopy: Molecular complexing in solution and in living cells. Methods Cell Biol. 2013;114:489–524. doi: 10.1016/B978-0-12-407761-4.00021-X. [DOI] [PubMed] [Google Scholar]
- 52.Fulco M, et al. Sir2 regulates skeletal muscle differentiation as a potential sensor of the redox state. Mol Cell. 2003;12(1):51–62. doi: 10.1016/s1097-2765(03)00226-0. [DOI] [PubMed] [Google Scholar]
- 53.Prozorovski T, et al. Sirt1 contributes critically to the redox-dependent fate of neural progenitors. Nat Cell Biol. 2008;10(4):385–394. doi: 10.1038/ncb1700. [DOI] [PubMed] [Google Scholar]
- 54.Asher G, Sassone-Corsi P. Time for food: The intimate interplay between nutrition, metabolism, and the circadian clock. Cell. 2015;161(1):84–92. doi: 10.1016/j.cell.2015.03.015. [DOI] [PubMed] [Google Scholar]
- 55.Aguilar-Arnal L, et al. Cycles in spatial and temporal chromosomal organization driven by the circadian clock. Nat Struct Mol Biol. 2013;20(10):1206–1213. doi: 10.1038/nsmb.2667. [DOI] [PMC free article] [PubMed] [Google Scholar]
- 56.Zheng L, Roeder RG, Luo Y. S phase activation of the histone H2B promoter by OCA-S, a coactivator complex that contains GAPDH as a key component. Cell. 2003;114(2):255–266. doi: 10.1016/s0092-8674(03)00552-x. [DOI] [PubMed] [Google Scholar]
- 57.Datta R, Alfonso-García A, Cinco R, Gratton E. Fluorescence lifetime imaging of endogenous biomarker of oxidative stress. Sci Rep. 2015;5:9848. doi: 10.1038/srep09848. [DOI] [PMC free article] [PubMed] [Google Scholar]
- 58.Scott TG, Spencer RD, Leonard NJ, Weber G. Synthetic spectroscopic models related to coenzymes and base pairs. V. Emission properties of NADH. Studies of fluorescence lifetimes and quantum efficiencies of NADH, AcPyADH, [reduced acetylpyridineadenine dinucleotide] and simplified synthetic models. J Am Chem Soc. 1970;92(3):687–695. [Google Scholar]
- 59.Magde D, Elson E, Webb WW. Thermodynamic fluctuations in a reacting system-measurement by fluorescence correlation spectroscopy. Phys Rev Lett. 1972;29(11):705–708. [Google Scholar]
- 60.Brown CM, et al. Raster image correlation spectroscopy (RICS) for measuring fast protein dynamics and concentrations with a commercial laser scanning confocal microscope. J Microsc. 2008;229(Pt 1):78–91. doi: 10.1111/j.1365-2818.2007.01871.x. [DOI] [PMC free article] [PubMed] [Google Scholar]
- 61.Menssen A, et al. The c-MYC oncoprotein, the NAMPT enzyme, the SIRT1-inhibitor DBC1, and the SIRT1 deacetylase form a positive feedback loop. Proc Natl Acad Sci USA. 2012;109(4):E187–E196. doi: 10.1073/pnas.1105304109. [DOI] [PMC free article] [PubMed] [Google Scholar]
- 62.Shaner NC, et al. Improving the photostability of bright monomeric orange and red fluorescent proteins. Nat Methods. 2008;5(6):545–551. doi: 10.1038/nmeth.1209. [DOI] [PMC free article] [PubMed] [Google Scholar]
- 63.Jameson DM. Introduction to Fluorescence. Taylor & Francis; London: 2014. [Google Scholar]


