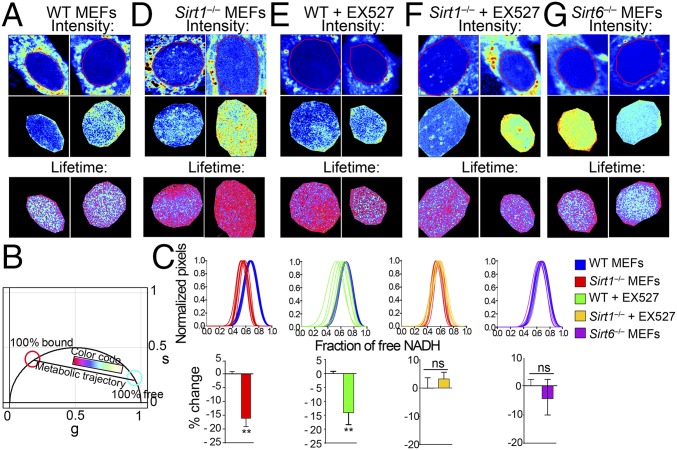
Fig. 1.
Nuclear territories for metabolic states in MEFs. (A) Intensity (before and after masking) and lifetime (FLIM) images for WT MEFs. Two representative images are shown (n = 10–15 single cells). Triplicate experiments were performed. (B) Phasor plot shows the color scale used in this study to visualize metabolic trajectories or the fraction of free/bound NADH in FLIM images. (C) Histograms in Upper show comparative analyses by overlapping the fractional free NADH distributions from two different populations of cells as indicated in the color legend. The fraction of free NADH is represented in the x axis, where 1 = 100% free NADH; n = 10–15 single cells per experiment. Graphs in Lower represent the percentage change on the fraction of free NADH for each comparative analysis from the corresponding histogram in Upper. Data were normalized for WT or nontreated condition = 0. Means ± SEM of three independent experiments are presented. ns, Not significant by two-tailed MWU. **P < 0.01 by two-tailed MWU. (D–G) Intensity and lifetime (FLIM) images from (D) Sirt1−/−MEFs, (E) WT MEFs, and (F) Sirt1−/−MEFs treated with EX527 (50 μM during 20 h) and (G) Sirt6−/−MEFs. Two representative images are shown (n = 10–15 single cells). Each experiment was performed in triplicate.

