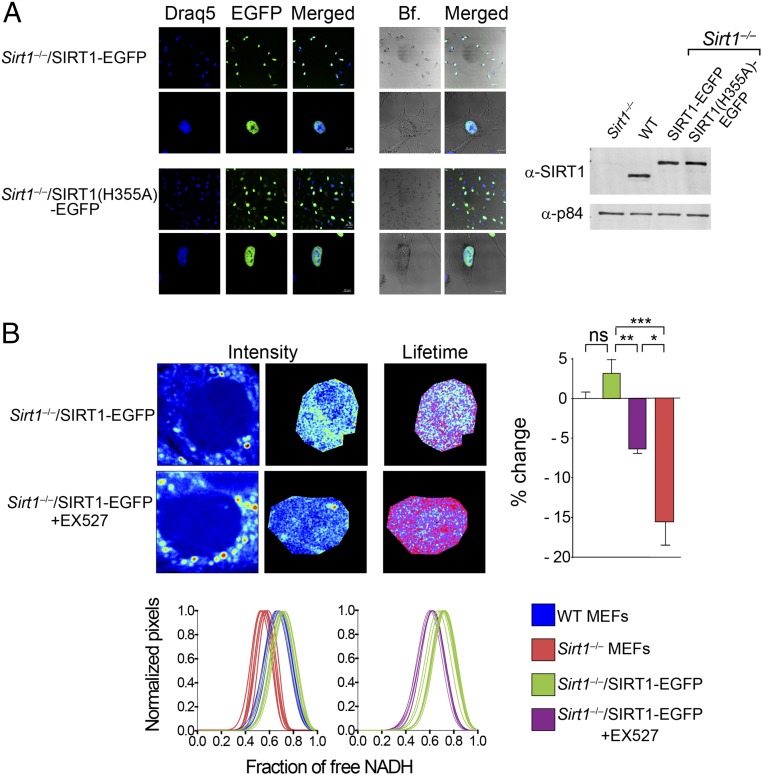
Fig. 4.
Expression of catalytically active SIRT1 rescues NADH lifetime and distribution in the cell nucleus from Sirt1−/− MEFs. (A) Confocal images from Sirt1−/− MEFs stably expressing EGFP-fused SIRT1 protein or the catalytically inactive mutant form SIRT1(H355A). Western blot was performed on total extracts from the indicated cell lines and blotted with a specific antibody against SIRT1. Anti-p84 was used as a loading control. (B) Intensity and FLIM (lifetime) representative images from Sirt1−/−/SIRT1-EGFP MEFs either untreated or treated with the SIRT1-specific inhibitor EX527 (50 μM) during 20 h. Individual fractions of free NADH distribution for 10–15 single cells are shown in histograms in Lower and overlapped with those from WT and Sirt1−/− MEFs (from Fig. 1) as indicated with the color code. The histogram in Right shows comparative analyses in the percentage change on the fraction of free NADH. Data were normalized for nontreated WT MEFs = 0. Means ± SEM of three independent experiments are presented. ns, Not significant by two-tailed MWU. *P < 0.05 by two-tailed MWU; **P < 0.01 by two-tailed MWU; ***P < 0.001 by two-tailed MWU. Bf, bright field.

